

Abstract
Conflicting reports are available with regard to the effects of childhood abuse and neglect on hippocampal function in children. While earlier imaging studies and some animal work have suggested that the effects of early-life stress (ELS) manifest only in adulthood, more recent studies have documented impaired hippocampal function in maltreated children and adolescents. Additional work using animal modes is needed to clarify the effects of ELS on hippocampal development. In this regard, genomic, proteomic, and molecular tools uniquely available in the mouse make it a particularly attractive model system to study this issue. However, very little work has been done so far to characterize the effects of ELS on hippocampal development in the mouse. To address this issue, we examined the effects of brief daily separation (BDS), a mouse model of ELS that impairs hippocampal-dependent memory in adulthood, on hippocampal development in 28-day-old juvenile mice. This age was chosen because it corresponds to the developmental period in which human imaging studies have revealed abnormal hippocampal development in maltreated children. Exposure to BDS caused a significant decrease in the total protein content of synaptosomes harvested from the hippocampus of 28-day-old male and female mice, suggesting that BDS impairs normal synaptic development in the juvenile hippocampus. Using a novel liquid chromatography multiple reaction monitoring mass spectrometry (LC-MRM) assay, we found decreased expression of many synaptic proteins, as well as proteins involved in axonal growth, myelination, and mitochondrial activity. Golgi staining in 28-day-old BDS mice showed an increase in the number of immature and abnormally shaped spines and a decrease in the number of mature spines in CA1 neurons, consistent with defects in synaptic maturation and synaptic pruning at this age. In 14-day-old pups, BDS deceased the expression of proteins involved in axonal growth and myelination, but did not affect the total protein content of synaptosomes harvested from the hippocampus, or protein levels of other synaptic markers. These results add two important findings to previous work in the field. First, our findings demonstrate that in 28-day-old juvenile mice, BDS impairs synaptic maturation and reduces the expression of proteins that are necessary for axonal growth, myelination, and mitochondrial function. Second, the results suggest a sequential model in which BDS impairs normal axonal growth and myelination before it disrupts synaptic maturation in the juvenile hippocampus.
Introduction
Earlier imaging studies found reduced hippocampal volume in adults who experienced childhood abuse or neglect, but not in maltreated children (reviewed in Andersen et al. [1]and Pechtel and Pizzagalli [2]). These initial findings led to a long-held dogma in the field suggesting that the effects of early-life stress (ELS) on hippocampal function and structure are manifested only in adulthood. However, more recent work has reported abnormal hippocampal function in children and adolescents exposed to abuse or neglect [3, 4, 5, 6, 7], indicating that ELS can impair hippocampal development. Additional work is therefore needed to determine whether exposure to ELS perturbs normal hippocampal development or interferes primarily with cellular processes that are necessary to maintain normal hippocampal function in adulthood.
Conflicting results have also emerged in the animal literature. While some studies have found synaptic abnormalities and ELS-mediated impairments in the Morris water maze to occur only later in life [8, 9], others have documented abnormal synaptic alterations in the developing hippocampus of rodents exposed to ELS [10, 11, 12]. This discrepancy might be related to different ELS paradigms, different genetic backgrounds, and a limited selection of synaptic targets. In this regard, the genetic, genomic, and proteomic tools available in the mouse make it a particularly attractive animal model to address these discrepancies. However, most of the mouse work to date has focused on the effects of ELS on hippocampal function and structure in adulthood, with little effort made to use unbiased genomic or proteomic approaches to study its effects on hippocampal development. For example, we are aware of only one study that utilized an unbiased genomic approach to search for developmental pathways affected by ELS in the developing mouse hippocampus [13], and so far no group has used a proteomic approach to study this question.
To address this issue, we developed a mouse model of ELS. This paradigm exposes pups of the highly stress reactive mouse strain, BALB/cByj, to brief daily separation (BDS) during the first 3 weeks of life in the absence of nesting material (impoverished conditions). Exposure to BDS is associated with prolonged elevation of corticosterone levels and blunted hippocampal growth during the second week of life [14, 15]. Adult BDS mice show an increase in several anxiety-like behaviors and a severe impairment in the Morris water maze and object recognition test, indicating impaired hippocampal-dependent function in adulthood. We have repeated these findings across several independent cohorts of mice to demonstrate the robustness and reproducibility of behavioral outcomes in BDS mice [13, 14]. In this report, we characterized the effect of BDS on hippocampal development using a novel targeted proteomic assay [16] and Golgi staining. Our findings demonstrate that BDS inhibits spine maturation in 28-day-old juvenile mice, which is accompanied by a reduced expression of proteins involved in axonal growth, myelination, and mitochondrial activity. Abnormal synaptic development occurs in the hippocampus between the second and fourth week of life and is preceded by a decrease in the expression of proteins that are necessary for axonal growth and myelination. Together, these findings support the notion that exposure to ELS perturbs multiple pathways that are critical for normal hippocampal development.
Materials and Methods
Animals
BALB/cByj mice (Stock No. 001026, Jackson Laboratories) were housed in standard Plexiglas cages and kept on a standard 12:12-hour light-dark cycle (lights on at 7:00 a.m.), constant temperature and humidity (22°C and 50%), and food provided ad libitum. The Institutional Animal Care and Use Committee (IACUC) at Yale University approved all studies.
Brief Daily Maternal Separation
The BDS procedure was done as described previously [14]. In brief, visibly pregnant dams were placed individually in maternity cages with 750 ml of corncob bedding but no nesting material. At birth [postnatal day (PND) = 0], pups were culled to 6-8 pups per litter, and litters were randomly assigned to either BDS or control condition. The separation procedure occurred daily from PND1-21 and was done from 11:00-11:40 a.m. During each BDS session, the dam was removed from the home cage and placed in a holding cage, covered with fresh corncob bedding, and provided with food and water. Pups were transferred individually into a new cage, covered with clean corncob bedding, and placed at different corners of a 20.3 × 27.9 cm standard cage. The cages were left undisturbed for 15 min at ambient temperature in the vivarium (22 ± 2°C) during which the pups were free to move about their holding cage. After 15 min of separation, the pups were individually transferred back to their home cage, followed by the return of the dam. On PND22, pups were weighed and housed in groups of 3-5 littermates of the same sex in cages with 500 ml of corncob bedding but no nesting material. On PND28, the mice were processed to harvest synaptosomes from the hippocampus and to assess spine density using Golgi staining. An additional cohort was processed as described above and was used to collect synaptosomes from the developing hippocampus on PND14.
Synaptosomal Preparation
Synaptosomal preparation (P2 fraction) was generated using previously published protocols [17, 18]. This method was chosen because of its speed, reproducibility, and ability to enrich for synaptic proteins [19]. In brief, PND14 or -28 offspring were rapidly decapitated and the right hippocampus was dissected and placed in a 2-ml Dounce homogenizer (Kontes Glass Co.) containing 500 μl of ice-cold buffer A [HEPES 4 mM pH 7.4, 320 mM sucrose, 1 mM DTT, and protease inhibitor cocktail (cat. No. P2714, Sigma)]. Hippocampal tissue was homogenized using 10 slow strokes. The homogenate was transferred into a cold Eppendorf tube and centrifuged for 5 min at 1,000 g at 4°C to remove nuclei and cell debris (P1 fraction). The supernatant was transferred to a new Eppendorf tube and centrifuged for 20 min, 15,000 g, at 4°C. The supernatant containing soluble proteins was transferred to a new Eppendorf tube (S2) and snap frozen in liquid nitrogen. The remaining pellet (P2 fraction), containing the crude synaptosomes, was snap frozen in liquid nitrogen and stored at -80°C for later use in proteomic studies and/or Western blots.
Liquid Chromatography Multiple Reaction Monitoring Mass Spectrometry
A detailed characterization of the liquid chromatography multiple reaction monitoring mass spectrometry (LC-MRM) mouse/rat postsynaptic density assay was recently published [16], and additional information about this assay is available in the supplementary information (for all online suppl. information, see www.karger.com/doi/10.1159/000430861). In brief, samples were treated with 4.1 mM DTT to reduce cysteines, digested with trypsin (1:15 ratio) for 15 h at 37°C, and quenched with 12 μl 20% TFA. Peptides were then desalted, dried, and dissolved in 20 μl 3:8 v/v 70% FA/0.1% TFA. Total peptide concentration was adjusted to 0.2 μg/μl using 0.1% TFA. Stable isotope peptide standards were added to the unlabeled peptides at a final concentration of 100 fmol/μl. For multiple reaction monitoring, 1 μg (5 μl) of peptide/stable isotope peptide standards mixture was loaded onto a 180-μm × 20-mm 5-μm Symmetry C18 nanoACQUITY trapping column with 2% ACN/0.1% FA at 15 μl per min for 3 min. After trapping, a 2-40%, 60 min linear ACN/0.1% FA gradient was run at a flow rate of 500 nl/min with a 75-μm × 150-mm 1.7-μm BEH130 C18 nanoAcquity column. Data were acquired with 1,371 transitions/sample at peak windows of 5 min, and a cycle time of 2.5 s. Transition peaks were quantitated using Multiquant™ 2.1 software (research version) and the SignalFinder™ 2 algorithm. All raw data and methods have been uploaded to PeptideAtlas (http://www.peptideatlas.org/PASS/PASS00550).
Western Blots
Protein samples (50 μg/lane) were separated on a 12% Criterion™ TXG Stain Free Midi-Gel (cat. No. 567-8044, Bio-Rad) followed by a 1-min UV activation using the ChemiDoc XRST imaging system (Bio-Rad). Proteins were then transferred to a nitrocellulose membrane (cat. No. 170-4159, Bio-Rad) via the Trans-Blot Turbo system (Bio-Rad), and total protein load in each lane was quantified using the ChemiDoc XRST imaging system (see bottom panels in fig. 2 and 5). Membranes were subsequently blocked for 60 min at room temperature in 5% Omniblock (in PBS with 0.1% Tween-20), and incubated with primary antibodies at 4°C overnight with gentle shaking. A complete list of all the primary antibodies used is provided in online supplementary table S1. Membranes were washed with PBS containing 0.1% Tween-20 and incubated with the appropriate secondary antibodies conjugated with HRP for 1 h at room temperature. Proteins were detected using a Western Lightning® Western Blot Chemiluminescence Reagent Plus kit (NEL104001EA, PerkinElmer), quantified using the ChemiDoc XRST imaging system, and normalized to membrane load [20]. Similar results were obtained when GADPH or actin proteins were used to normalize protein levels. To assess enrichment of synaptic proteins in the synaptosome fraction, 20 μg of total proteins from the P1 (nuclear fraction), S2 (soluble fraction), and P2 (synaptosome fraction) collected from 6 control hippocampi were separated on a 12% Criterion™ TXG Stain Free Midi-Gel and quantified as described above. The percentages of histone 3 in the synaptosome (P2) fraction was calculated as follows: %P2 Histone 3 = (P2 Histone 3 × 100)/(P1 Histone 3 + P2 Histone 3 + S2 Histone 3). Similar calculations were used to assess %P1 and %S2 for histone 3, PSD95, and synaptophysin.

The hippocampus undergoes major developmental changes during the first 3 weeks of life. a Western blot showing how levels of NDUFV1 (mitochondrial protein), NFM (cytoskeleton protein), PSD95 (synaptic protein), and MBP (myelin protein) change during normal hippocampus development. Equal loading is shown as protein load at the bottom of the gel. b Protein levels were normalized to protein load and used to determine the rate of maturation of each protein in the hippocampus. n = 9 male control mice in each time point. Error bars represent means ± SEM.
The hippocampus undergoes major developmental changes during the first 3 weeks of life. a Western blot showing how levels of NDUFV1 (mitochondrial protein), NFM (cytoskeleton protein), PSD95 (synaptic protein), and MBP (myelin protein) change during normal hippocampus development. Equal loading is shown as protein load at the bottom of the gel. b Protein levels were normalized to protein load and used to determine the rate of maturation of each protein in the hippocampus. n = 9 male control mice in each time point. Error bars represent means ± SEM.
Golgi Staining
Golgi staining was done as previously described [13]. Briefly, the left hemisphere from PND28 male mice (control n = 7; BDS n = 7) was stained with the rapid GolgiStain™ kit (FD NeuroTechnologies), cut at 100-micron sagittal sections on a cryostat, and processed according to the manufacturer's instructions. Stained slides were coded to ensure that morphological analysis was conducted by an observer who was blind to the animals' developmental history. CA1 pyramidal cells, located in the dorsal hippocampus (n = 10 cells for each animal), that were fully impregnated and free of neighboring cells or cellular debris were randomly selected for analysis. Cells were traced using the shaft method and the dendritic length and the number of branch points calculated using Neurolucida 9.0 (MBF Bioscience) software. Spines were classified as mature (stubby or mushroom) or immature (shafts or filopodia) as previously described [21], and counted on secondary and tertiary dendritic segments (n = 3 segments per cell, 20-30 μm in length). Spine density for each spine category was calculated for each segment and averaged across the 3 measurements to obtain the spine density for secondary and tertiary apical branches for each animal.
Developmental Studies
To assess normal hippocampal development, Balb/cByj mice were subjected to the control condition outlined above (no BDS group). Brain tissue was harvested at six developmental time points: PND7, -14, -22, -28, -42, and -63. The mice were rapidly decapitated and the hippocampi were dissected rapidly and frozen in liquid nitrogen. All dissections were done between 2:00 and 5:00 p.m. to minimize circadian effects on gene expression. Hippocampal tissue (n = 9 males from each developmental age) was rapidly thawed in cold lysis buffer from the AllPrep DNA/RNA/Protein Mini Kit (cat. No. 80004, Qiagen), homogenized (10 × 1-second pulses) using an ultrasonic processor (Cole-Parmer CP70), and spun at 16,000 g for 3 min. RNA, DNA, and proteins were then purified using the AllPrep DNA/RNA/Protein Mini Kit according to the manufacturer's instructions.
Statistical Analysis
The labeled multiple reaction monitoring assay monitored 628 heavy transitions and 743 light transitions from 7 BDS and 7 control samples. For quality control, we removed 84 heavy-labeled transitions (from 4 different samples) due to abnormally low intensity. Five additional transitions were removed due to abnormal signals (<5). The relative peak area for each transition was then evaluated using the ratio of light to heavy peak area. Differential expression between the BDS and control groups was assessed at the transition and protein levels. The transition-level analysis was done using Welch's t test on the log2-transformed relative peak area for each transition (online suppl. table S5). The protein-level analysis was done using a linear-mixed effects model that decomposed the log2 relative area by the effects of stress, transition, and random effects of individual samples (online suppl. table S4). Additional discussion on the linear-mixed model can be found in the article by Chang et al. [22]. All calculations were carried out in R. Unpaired Student t tests (2 tails) were used to assess the effect of BDS on synaptosomal protein levels and spine density. One-way ANOVA was used to compare the effect of age on protein levels, with Tukey-HSD post hoc analysis used to follow the significant main effects of genotype. SPSS Statistics 21 software (IBM) was used for statistical analysis with p < 0.05 considered as significant.
Results
First, we tested the ability of our synaptosome preparation to fractionate synaptic and nuclear proteins. We found that 75% and 90% of the synaptic markers, PSD95 and synaptophysin, were present in the synaptosomal (P2) fraction, respectively, and more than 95% of the nuclear marker, histone 3, was found in the nuclear fraction (P1). These data confirm that the synaptosomal fraction (P2) is highly enriched for synaptic proteins (fig. 1a). Next, we harvested synaptosomes from the hippocampus of PND28 male mice exposed to BDS or control condition (control n = 8, BDS n = 7). This age was chosen because it allows mice 1 week to recover from the acute effects of BDS (fig. 1b), and because it corresponds to a developmental period in which human imaging studies have reported abnormal hippocampal development in maltreated children [3, 4, 5, 6, 7]. BDS did not affect the body weight [control = 11.9 ± 0.68 g, BDS = 11.8 ± 0.66 g, t(13) = 0.134, p = 0.89], or the total amount of proteins harvested from the hippocampus [control = 4.16 ± 0.12 mg, BDS = 4.09 ± 0.12 mg, t(13) = 0.416, p = 0.68]. The protein content of the hippocampal synaptosomes (P2) was 20% lower in BDS compared to control mice [t(13) = 4.59, p < 0.0005; fig. 1c], suggesting that BDS impairs normal synaptic development in the hippocampus. To search for differential protein expression between BDS and control mice, we loaded 1 μg of synaptosomal proteins onto the LC-MRM mouse/rat postsynaptic density assay. Exposure to BDS caused a 10-30% decrease in many of the 112 proteins screened, as demonstrated by the large number of dots that fell below the dotted line in figure 1d. Path analysis of the 23 most highly regulated proteins (p < 0.06) indicates that 8 proteins are synaptic proteins, 7 are involved in axonal growth, 6 are mitochondrial proteins, and 2 play important roles in myelination (fig. 1e, table 1).
List of the most significant changes in synaptic proteins affected by BDS

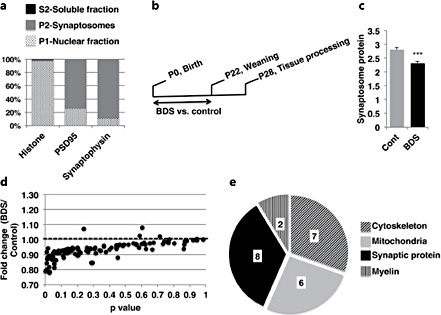
Levels of many synaptic proteins are decreased in PND 28 male mice exposed to BDS. a Relative levels of histone 3, PSD95, and synaptophysin in P1 (nuclear fraction), P2 (synaptosomal fractions), and S2 (soluble fraction). The y-axis shows the relative distribution for each protein across the different fractions as a percentage of the total protein. b Experimental timeline. c Total protein content in synaptosomal fraction (P2) in PND 28 BDS and control male mice. d LC-MRM assay was used to calculate the relative levels of 112 synaptic proteins in synaptosomes harvested from the hippocampus of BDS and control juvenile mice. Note that the same amount of proteins (1 μg) was used in all samples. The y-axis is the ratio of protein levels between BDS and control. Numbers that are below the dotted line (BDS/control <1) indicate lower protein levels in BDS mice. e Path analysis for significant differences between BDS and control. Control n = 8, BDS n = 7 male mice. Error bars represent means ± SEM. *** p < 0.0005, independent t tests.
Levels of many synaptic proteins are decreased in PND 28 male mice exposed to BDS. a Relative levels of histone 3, PSD95, and synaptophysin in P1 (nuclear fraction), P2 (synaptosomal fractions), and S2 (soluble fraction). The y-axis shows the relative distribution for each protein across the different fractions as a percentage of the total protein. b Experimental timeline. c Total protein content in synaptosomal fraction (P2) in PND 28 BDS and control male mice. d LC-MRM assay was used to calculate the relative levels of 112 synaptic proteins in synaptosomes harvested from the hippocampus of BDS and control juvenile mice. Note that the same amount of proteins (1 μg) was used in all samples. The y-axis is the ratio of protein levels between BDS and control. Numbers that are below the dotted line (BDS/control <1) indicate lower protein levels in BDS mice. e Path analysis for significant differences between BDS and control. Control n = 8, BDS n = 7 male mice. Error bars represent means ± SEM. *** p < 0.0005, independent t tests.
To assess the reliability of the proteomic results, we chose 10 proteins (1 mitochondrial protein, 3 cytoskeleton proteins, 4 synaptic proteins, and 2 myelin-related proteins) and tested their relative levels using Western blots (fig. 2a). Nine out of the 10 proteins showed statistically significant reductions in expression levels that closely mirrored our LC-MRM data (fig. 2b, table 1). The only exception was the myelin-related protein PLP1, which showed the expected 25% decrease but did not reach statistical significance in juvenile males (fig. 2b, online suppl. table S2).

Western blot confirmation of proteomic data. a Western blot gel showing levels of 10 proteins selected for secondary validation based on the proteomic data. Equal protein loading is shown at the bottom (protein load) and is the image of activated fluorescent proteins detected by the Stain-Free Gel. b Quantification summary of Western blots. c BDS decreases expression of several key synaptic proteins. Error bars represent means ± SEM. * p < 0.05, ** p < 0.01, independent t tests.
Western blot confirmation of proteomic data. a Western blot gel showing levels of 10 proteins selected for secondary validation based on the proteomic data. Equal protein loading is shown at the bottom (protein load) and is the image of activated fluorescent proteins detected by the Stain-Free Gel. b Quantification summary of Western blots. c BDS decreases expression of several key synaptic proteins. Error bars represent means ± SEM. * p < 0.05, ** p < 0.01, independent t tests.
Given the global decrease in synaptic proteins seen in 28-day-old males exposed to BDS, we tested several other key synaptic proteins not included in the targeted proteomic assay. In figure 2c, we show that BDS decreased the expression of the glutamate metabotropic receptor 5 [mGluR5, t(13) = 2.67, p = 0.019], PSD95 [t(13) = 2.32, p = 0.037], glutamate AMPA receptor 1 [GluR1, t(13) = 2.256, p = 0.042], and the glutamate AMPA receptor 2 [GluR2, t(13) = 2.595, p = 0.022]. Additionally, we observed a significant decrease in levels of the synaptic protein nectin-3 [t(13) = 2.45, p = 0.029] in mice exposed to BDS (fig. 2c, online suppl. table S2). These findings demonstrate that BDS decreases the expression of many critical synaptic proteins, suggesting that BDS disrupts fundamental processes that support normal synaptic development in the hippocampus.
To further study the effects of BDS on synaptic development, we used Golgi staining to characterize spine density, spine morphology, and dendritic arborization in CA1 pyramidal neurons of 28-day-old BDS and control male mice (n = 7 in each group). BDS did not affect the total dendritic length [control = 771 ± 130 μm, BDS = 1,007 ± 168 μm, t(12) = 1.32, p = 0.21] or the number of dendritic branches in CA1 cells [control = 13.8 ± 0.84, BDS = 13.9 ± 0.81, t(12) = 0.125, p = 0.90]. Mice exposed to BDS had significantly higher spine density in tertiary dendrites [t(12) = 3.00, p = 0.011, fig. 3a]. This increase in spine density was due to a large increase in the total number of immature spines (fig. 3b, c) that included a 10-fold increase in the number of filopodia seen in BDS mice (fig. 3d, e; online fig. S1). In contrast, exposure to BDS was associated with a significant decrease in the number of mature spines [t(12) = 3.06, p = 0.01, fig. 3f]. Similar findings were also observed in secondary apical dendrites (online suppl. table S3).

BDS increases the number of immature spines while decreasing the number of mature spines in tertiary apical dendrites of CA1 neurons. a Total spine density in tertiary apical dendrites. b Scheme used to classify spines into mature and immature categories. Exposure to BDS increases spine density of total immature spines (c), most notably filopodia (d). e Pictures of tertiary apical dendrites showing the presence of abnormally elongated filopodia that are commonly seen in BDS juvenile mice. f Spine density of mature spines. Error bars represent means ± SEM. * p < 0.05, ** p < 0.01, *** p < 0.001, independent t tests; scale bars in e are 1 μm.
BDS increases the number of immature spines while decreasing the number of mature spines in tertiary apical dendrites of CA1 neurons. a Total spine density in tertiary apical dendrites. b Scheme used to classify spines into mature and immature categories. Exposure to BDS increases spine density of total immature spines (c), most notably filopodia (d). e Pictures of tertiary apical dendrites showing the presence of abnormally elongated filopodia that are commonly seen in BDS juvenile mice. f Spine density of mature spines. Error bars represent means ± SEM. * p < 0.05, ** p < 0.01, *** p < 0.001, independent t tests; scale bars in e are 1 μm.
Given that imaging studies found comparable hippocampal deficits in maltreated boys and girls [3, 4, 5, 6, 7], we tested whether BDS perturbs similar developmental pathways in PND28 female mice (control n = 8, BDS n = 8). We found that the total amount of synaptosomal proteins was lower in BDS females compared to control females [t(14) = 2.869, p = 0.012; figure 4a]. In addition, BDS reduced the expression in levels of NDUFV1 [t(14) = 3.12, p = 0.008], NFM [t(14) = 1.97, p = 0.042], NFL [t(14) = 2.683, p = 0.018], CamK2 [t(14) = 1.96, p = 0.05], MMDE2/NR2B [t(14) = 1.98, p = 0.047], MBP [t(14) = 3.673, p = 0.006], PLP1 [t(14) = 2.751, p = 0.016], PSD95 [t(14) = 2.57, p = 0.022], GluR1 [t(13) = 4.07, p = 0.001], and GluR2 [t(14) = 2.307, p = 0.037]. These findings indicate that BDS causes similar deficits in the developing hippocampus of both juvenile males and females.

BDS causes similar changes in juvenile female mice. a BDS decreased the total amount of synaptic synaptosomal proteins (P2 fraction) in 28-day-old female mice. Proteins selected for secondary validation based on the proteomic data in males (b) and additional key synaptic proteins (c) showed a similar decrease in female mice. Control n = 8, BDS n = 8 female mice. Error bars represent means ± SEM. * p < 0.05, ** p < 0.01, independent t tests.
BDS causes similar changes in juvenile female mice. a BDS decreased the total amount of synaptic synaptosomal proteins (P2 fraction) in 28-day-old female mice. Proteins selected for secondary validation based on the proteomic data in males (b) and additional key synaptic proteins (c) showed a similar decrease in female mice. Control n = 8, BDS n = 8 female mice. Error bars represent means ± SEM. * p < 0.05, ** p < 0.01, independent t tests.
Our proteomic data suggest that exposure to BDS impairs synaptic maturation, axonal growth, mitochondrial activity, and myelination (fig. 1e). To estimate the relative rates at which these four cellular processes mature in the developing hippocampus, we used NDUFV1, NFM, PSD95, and MBP as markers of mitochondrial biogenesis, axonal growth, synaptogenesis, and myelination, respectively. Levels of the mitochondrial protein NDUFV1 peaked on PND7 and then declined by 50% to reach adult-like levels by PND14 (fig. 5a, b). Similar patterns were observed with other mitochondrial markers (cytochrome C and ATP5A1, data not shown), suggesting that higher levels of mitochondrial activity are required to support hippocampal development during the first week of life. Levels of the intermediate neurofilament protein, NFM, increased dramatically during the first 3 weeks of life, at which point it continued to increase slightly into adulthood (fig. 5a, b). NFM levels on PND22 were not statistically different than those detected on PND63 (p = 0.078), suggesting that axonal growth in the developing hippocampus matures at around PND22. Similar findings were obtained with another neurofilament protein (NFL) and are consistent with previous work in the rat showing increased levels of neurofilament proteins in the developing hippocampus [23]. PSD 95 levels increased dramatically during the first 3 weeks of life, reaching adult-like levels on PND28 (fig. 5a, b). Levels of MBP were low until PND14, at which point they increased linearly into adulthood (fig. 5a, b). Similar developmental patterns were seen with other markers of myelin (PLP1 and CA2, data not shown). These findings indicate that among these four processes, mitochondrial biogenesis matures first in the developing hippocampus, followed by axonal growth, then synaptogenesis, and myelination being the slowest process to mature.
Next, we asked whether BDS also reduces the expression of proteins involved in synaptogenesis, axonal growth, myelination, and mitochondrial activity in synaptosomes harvested from the hippocampus of 14-day-old pups (n = 11 in each group). Exposure to BDS did not affect the total body weight or the total amount of proteins extracted from the hippocampus in the pups (data not shown). In contrast to our PND28 data (fig. 1c, 4a), there was no significant difference in the total amount of synaptosomal proteins between BDS and control mice on PND14 (fig. 6a). Moreover, none of the synaptic (e.g. Camk2a, DLGP1, DLG3, PSD95, NR2B, mGluR5, GluR1, GluR2, and nectin-3) or mitochondrial (e.g. NDFUV1, cytochrome C, and ATPA) proteins tested showed a significant decrease in 14-day-old BDS pups (fig. 6b, c, and data not shown). However, most strikingly, 14-day-old BDS mice showed a significant decrease in the expression of neurofilament proteins [NFL t(20) = 2.53, p = 0.02 and NFM t(20) = 2.60, p = 0.017] and myelin-related proteins [MBP t(19) = 2.30, p = 0.033] and PLP1 [t(19) = 3.10, p = 0.006; fig. 6b] in a manner that was similar to our findings in 28-day-old mice (fig. 2, 4).

BDS decreased expression of proteins involved in myelination and neurofilament formation, but not synaptic maturation, in 14-day-old pups. a BDS does not affect the protein content of synaptosomes harvested from the hippocampus on PND14. b Western blot analysis of the 10 proteins selected for secondary validation of the proteomic data in 28-day-old juvenile mice. c BDS did not decrease levels of key synaptic proteins that were downregulated on PND28. Error bars represent means ± SEM. * p < 0.05, ** p < 0.01, independent t tests.
BDS decreased expression of proteins involved in myelination and neurofilament formation, but not synaptic maturation, in 14-day-old pups. a BDS does not affect the protein content of synaptosomes harvested from the hippocampus on PND14. b Western blot analysis of the 10 proteins selected for secondary validation of the proteomic data in 28-day-old juvenile mice. c BDS did not decrease levels of key synaptic proteins that were downregulated on PND28. Error bars represent means ± SEM. * p < 0.05, ** p < 0.01, independent t tests.
Discussion
BDS Impairs Normal Synaptic Maturation in the Developing Hippocampus
A key unanswered question in the field has been whether ELS affects normal hippocampal development, or whether it has a delayed onset that only interferes with cellular processes that are necessary to maintain normal hippocampal function in adulthood. This is not simply an academic question, but one that has important clinical implications with regard to the best time to intervene. Support for the developmental hypothesis comes from recent imaging studies [3, 4, 5, 6, 7] and animal work [10, 11, 12, 24] demonstrating abnormal synaptic alterations in the developing hippocampus of rodents exposed to ELS. However, several other imaging studies failed to find changes in hippocampal volume in maltreated children (for meta-analysis see Woon and Hedges [25]), and preclinical work from several groups found impaired performance in the Morris water maze and synaptic abnormalities to occur only later in life [8, 9]. This discrepancy is likely due to differences in methodology used to assess hippocampal function, genetic background, and the duration as well as intensity of the ELS paradigms used. In this regard, the genomics, proteomics, and molecular tools available in the mouse make it an attractive model system for studying this issue. Unfortunately, very little work has been done so far to characterize the effect of ELS on hippocampal development in the mouse. Here we use a novel proteomic approach [16] and Golgi staining to characterize the effects of BDS, a mouse model of ELS, on hippocampal development in 28-day-old juvenile mice. This age corresponds to a developmental period in which human imaging studies have shown abnormal hippocampal development in maltreated children [3, 4, 5, 6, 7]. Our results provide four lines of evidence to suggest that BDS causes substantial synaptic abnormalities at this age. First, the total protein content in synaptosomes harvested from the juvenile hippocampus was significantly lower in BDS male and female mice compared to controls (fig. 1c, 4a). Second, many of the 112 synaptic proteins included in the LC-MRM were downregulated in BDS male mice (i.e. the dots that are below the dotted line in fig. 1d). Third, using Western blots we confirmed the proteomic data and showed that several other key synaptic proteins that were not included in the proteomic screen were also downregulated in BDS juvenile mice (fig. 2c, 4c). Fourth, using Golgi staining we found an increase in the number of immature spines and a decrease in the number of mature spines in apical dendrites (fig. 3). We suspect that immature spines contain low levels of synaptic proteins such as PSD95, DLGP1, DLG3, and NR2B, providing a possible explanation for the decrease in the total levels of these proteins in synaptosomes harvested from BDS mice. This interpretation is consistent with data showing that levels of PSD95 and other synaptic proteins increase as spines mature into mushroom-like structures [26].
Our proteomic work is consistent with previous work examining the effects of ELS on protein expression in adult rodent brain as it relates to synaptic proteins and proteins involved in mitochondrial activity, axonal growth, and myelin formation [27, 28, 29]. This work extends these previous findings by showing that many of these changes are already present earlier in development. Moreover, unlike previous proteomic studies that have used tissue homogenates from specific brain regions [27, 28, 29], we fractionated the hippocampal homogenate to specifically examine the effect of ELS on synaptosomal content. This fractionation strategy allowed us to demonstrate that BDS decreases synaptosomal protein content in PND28 male (fig. 1c) and female mice (fig. 4a), but not in PND14 males (fig. 6a). The combined use of proteomics and synaptosomal fractionation revealed a global disruption in synaptic maturation in a way that could not be appreciated using more targeted Western blot approaches. A good example is the observation that BDS decreases the expression of the synaptic protein nectin-3 (fig. 2c). This is interesting because recent work using a different mouse model of ELS showed that inhibition of nectin-3 decreases synapse formation at CA3 pyramidal neurons and impairs hippocampal-dependent memory in adult mice exposed to ELS [30].
While the effect sizes found by the proteomic approach may be relatively small, the true magnitude of the effect BDS has on hippocampal synaptic development in 28-day-old mice is likely to be significantly larger when taking into account the 20% reduction in total synaptosomal protein in juvenile mice exposed to BDS (fig. 1c, 4a). These results are not simply due to a global decrease in protein translation because BDS did not decrease total protein content in the hippocampus. Moreover, given that the same amounts of protein were used in all the LC-MRM reactions, there should still be some unidentified proteins that are upregulated in synaptosomes purified from BDS mice. We suspect that at least some of these proteins are abundant in immature filopodia-like spines.
Golgi staining on PND28 showed an increase in the number of spines in apical dendrites of CA1 pyramidal neurons (fig. 3a). This finding is consistent with previous work showing increased spine density in rodents exposed to ELS [10, 12, 31, 32, 33, 34, 35]. Further characterization of spine morphology indicates that this increase in spine density is mainly due to the presence of immature spines (fig. 3c-e) and it is accompanied by a decrease in the number of mature spines (fig. 3f). These observations suggest that on PND28, BDS interferes with synaptic maturation in CA1 neurons. Moreover, the presence of large numbers of immature and abnormally shaped spines resembles our previous findings in LBP knockout mice and is consistent with the notion that BDS interferes with microglia-mediated synaptic pruning [13]. We have preliminary data to suggest that BDS interferes with microglia function in the developing hippocampus, and we are testing whether this may contribute to the retention of immature spines in CA1 pyramidal cells.
The LC-MRM Mouse/Rat Postsynaptic Density Assay Provides a Powerful Tool to Identify Novel Developmental Pathways Affected by Early Adversity
This is the first study to use the LC-MRM mouse/rat postsynaptic density assay [16]. This novel assay was developed at the Yale/NIDA Neuroproteomics Center and provides rapid quantification of 112 synaptic proteins. We found remarkable agreement between the proteomic data and Western blot analysis (table 1). Using quantitative Western blots we confirmed a significant decrease in expression levels in 9 of the 10 proteins tested. These findings demonstrate that the LC-MRM approach provides a powerful and reliable screening tool to assess synaptic content in mice. The accuracy of this assay is due to the fact that each protein is represented by 3 unique peptides and 2 native transitions per peptide, providing 6 data points per protein. In addition, known amounts of stable isotope peptide standards are used to normalize the unlabeled transitions.
One of the most striking findings from the proteomic data is that BDS also inhibits the expression of proteins involved in axonal growth, mitochondrial activity, and myelination (fig. 1, 2, 4), all of which undergo dramatic changes during the first 3 weeks of hippocampal development (fig. 5). To the best of our knowledge, this is the first report showing that ELS inhibits these pathways in the developing mouse hippocampus. A key follow-up question is whether BDS independently disrupts the development of these pathways, or whether BDS impairs one developmental process that is necessary to complete subsequent cellular programs in the hippocampus. We started to examine this issue by characterizing the effects of BDS on synaptosomal proteins harvested from the hippocampus of 14-day-old pups. Exposure to BDS at this earlier age did not decrease the total amount of synaptosomal proteins harvested from the hippocampus, and it did not decrease the levels of the 9 synaptic proteins tested (e.g. Camk2a, DLGP1, DLG3, NR2B, mGluR5, PSD95, GluR1, GluR2, and nectin-3). In contrast, BDS inhibited the expression of PLP1 and MBP, which are the most abundant proteins in myelin [36]. BDS also decreased the expression of NFM and NFL, 2 subunits that are essential for the formation of type IV intermediate neurofilaments [37]. These findings suggest that BDS inhibits the expression of proteins involved in neurofilament formation and myelination before it impairs synaptic development in the hippocampus.
Here we propose that BDS first disrupts neurofilament formation on PND14, impairing axonal transport and growth, which in turn is necessary for normal myelination, mitochondrial transport into the synapse, and synaptic maturation (fig. 7). This model is supported by several observations. First, deletion of NFM or NFL causes a reduction in axonal caliber, conduction velocity, myelination, and mitochondrial transport [38, 39, 40, 41, 42, 43]. Second, these findings are consistent with a large body of work showing that axonal growth plays a critical role in guiding myelination [44]. Third, axonal transport is also essential for many aspects of synaptogenesis such as the recruitment of mitochondria and other structural proteins into the developing synapse [45, 46]. Fourth, expression of NFM and NFL in the hippocampus matures before that of the synaptic marker, PSD95 (fig. 5). Fifth, levels of MBP in the PND14 hippocampus are highly correlated with levels of NFM (r = 0.6, p = 0.007) and NFL (r = 0.7, p < 0.0005). Sixth, NFL knockout mice show deficits in spatial learning [47], consistent with the notion that intact neurofilament assembly is necessary to support normal hippocampal-dependent function. Lastly, exogenous administration of corticosterone decreases the expression of NFL and NFM in the adult hippocampus [48], suggesting that the expression of these cytoskeleton proteins is coordinately regulated by stress. Lower expression of neurofilament proteins persisting into PND28 suggests that the lingering effects of BDS extend beyond the exposure period. We recognize that additional work is needed to further substantiate this hypothesis.

Working model. During the first 2 weeks of life, BDS inhibits expression of proteins that are necessary to support neurofilament formation. Disruption of intermediate neurofilaments in neurons impairs normal myelination and the transport of mitochondria and other synaptic components that are necessary to support normal synaptic maturation in the hippocampus of 28-day-old offspring.
Working model. During the first 2 weeks of life, BDS inhibits expression of proteins that are necessary to support neurofilament formation. Disruption of intermediate neurofilaments in neurons impairs normal myelination and the transport of mitochondria and other synaptic components that are necessary to support normal synaptic maturation in the hippocampus of 28-day-old offspring.
BDS Inhibits the Formation of Myelin in the Developing Hippocampus in a Manner That Persists into the Juvenile Period
Our findings that BDS inhibits the expression of MBP and PLP1, the most abundant proteins in myelin [36], is consistent with work in children [49, 50, 51, 52] and nonhuman primates [53, 54, 55] showing that ELS inhibits myelination in early development. These findings support the face validity of BDS as an animal model of ELS and allow us to study the molecular mechanisms by which stress impairs myelin development. BDS inhibits the expression of MBP and PLP1 on PND14 (fig. 6), a period marked by the onset of myelination in the hippocampus (fig. 5), which persists in 28-day-old juvenile mice even in the absence of ongoing stress. These results add two important findings to previous work showing decreased myelination in the corpus callosum and prefrontal cortex of adult rodents exposed to ELS [28, 56, 57]. First, they demonstrate that these effects emerge early in development, and second, they show that myelination in the hippocampus is perturbed as well. Additional work is needed to clarify whether BDS reduces the number of oligodendrocytes and/or suppresses the maturation of oligodendrocytes. Moreover, it will be important to find out whether BDS directly interferes with myelination, or whether this is an indirect effect that is mediated by a reduction in axonal growth or spontaneous firing activity [58, 59].
This report adds two important findings to previous work in the field. First, it demonstrates that some forms of ELS, such as BDS, can cause substantial impairment in synaptic maturation in the juvenile hippocampus that is accompanied by a decrease in proteins implicated in neurofilament formation, myelination, and mitochondrial activity. Second, defects in neurofilament formation and myelination appear to be present at an earlier age in the hippocampus compared to deficits in mitochondrial synaptic proteins and synaptogenesis.
Acknowledgements
We thank Jean-Christophe Delpech and Evelyn Cumberbatch for helpful comments on the manuscript. This work was supported by NIMH R21MH098181, NIMH R01MH100078,DANA foundation Program in Brain and Immuno-Imagine 2011, and the Clinical Neuroscience Division of the VA National Center for PTSD.
Disclosure Statement
The authors declare no conflict of interest.
