

Abstract
Background: Mouse urinary proteins are relevant allergens from mice urine. We used the recombinant protein Mus m 1 as an allergen model to identify if, by altering Mus m 1 architecture via single-point mutations, we could effectively modify its allergenicity. Methods: Based on structural considerations, we synthesized two single-point mutants, Mus m 1-Y120A and Mus m 1-Y120F, which were expected to harbor large structural alterations. Circular dichroism and fluorescence analysis showed significant conformational rearrangements of the aromatic side chains in the internal cavity of Mus m 1-Y120A when compared to Mus m 1-Y120F and Mus m 1. Evaluation of the allergenic potential of the recombinant molecules was performed in vitro with both immunochemical approaches and assays based on the measurement of basophil degranulation. Moreover, to assess the integrity of the T cell epitopes and as an in vitro measure of immunogenicity, we tested the reactivity of T lymphocytes from subjects allergic to mouse urine against proteins and synthetic peptides encompassing the immunodominant linear epitope containing the mutation. Results: We found that the selected point mutation was able to modulate the protein allergenicity, and to severely impair the recognition of Mus m 1 by IgE, while T cell reactivity was fully maintained. Conclusions: In silico predicted, minimum selected structural modifications allowed to design one protein with reduced allergenicity and preserved immunogenicity. Structurally guided mutations can direct the design of proteins with reduced allergenicity which can be used as vaccines for a safer and more effective immunotherapy of allergic disorders.
Introduction
Mouse allergy is both an occupational disease [1, 2] and a disorder that can occur in homes [3, 4, 5], where it may negatively impact on the efficacious clinical control of asthmatic children: mouse urinary proteins (MUPs) represent the main etiologic agent of mouse allergy [6, 7], being excreted into the environment where they are extremely stable and can easily reach the airways. The MUPs belong to the lipocalin superfamily which includes several allergenic proteins, such as the major rat allergen (Rat n 1), dog allergens (Can f 1 and Can f 2), cow allergen (Bos d 5), horse allergen (Equ c 1) and cockroach allergen (Bla g 4) [8].
The genes coding for MUPs are clustered in chromosome 4 and are highly homologous [9]. There are 35 known MUP genes, which are subdivided into four groups based upon sequence homology and phylogenetic origin [10]. The majority of functional MUPs genes belong to group 1 [9, 10]. In that group there are 15 MUPs genes and their transcripts make up about 5% of male mouse liver RNA [11].
MUPs are soluble proteins synthesized mainly in the liver under hormonal influence that are transported via the blood and secreted in the urine [12]. MUP architecture, characterized by a typical β-barrel fold made up of eight antiparallel β-strands with a α-helix in the C-terminal region, creates an internal cavity recognized as the binding site for a variety of hydrophobic ligands. These are urine-specific compounds with pheromonal action that show sex- or status-specific expression [13, 14, 15], and trigger several reproductive and behavioral effects in another member of the same species [16, 17]. In fact, the proteins function as pheromone stabilizers, providing a slow release mechanism of the ligands into the environment [12, 14, 15, 18]. Furthermore, they also act as genetically encoded pheromones themselves: free of any ligand, they mediate male-male aggression [19], while, in interspecies interplay, predator’s urinary proteins act as kairomones, triggering fear response in mice through the accessory olfactory neural pathway [20].
In the past few years MUPs have received considerable attention in studies aimed to unveil the structural and energetic features of ligand binding in the protein hydrophobic pocket [21, 22, 23, 24]. It has been shown that mutation of Tyr120 modifies the structural organization of the ligand-binding pocket and it has been suggested this fact is due, primarily, to alterations of the hydrogen-bond network involving bound water molecules that stabilizes the overall protein architecture [22, 25].
Recombinant allergens are entering clinical practice as highly performing diagnostic tools [26] and it is expected they will shortly proceed to therapeutic applications [27]. In fact, their efficacy and safety has been proven in controlled clinical trials [28]. One of the advantages of immunotherapy with recombinant allergens is the possibility to mutate them in order to reduce their allergenicity (that is, IgE binding capability) while maintaining an adequate T cell stimulatory potential, which is required for the success of allergy vaccines [29, 30]. Indeed, modified allergens (also known as allergoids) minimize side effects and risks of fatal reactions during allergen administration [27]. Several strategies have been proposed to reduce allergenicity, including extended deletions of B cell epitopes identified by peptide scanning of the linear sequence [31], multiple mutations predicted to alter the architecture of the protein [29, 32, 33, 34] and oligomerization [35, 36, 37, 38, 39]. Along this line, Vieths’ group, using as a model the Daucus carotamajor allergen Dau c 1, confirmed that disruption of protein conformation is the roadmap to safe allergen vaccines [40]. Nonetheless, allergen variants may turn out not to be ideal for immunotherapy when the extended deletions, required to reduce their allergenicity, destroy crucial T cell epitopes [41, 42].
Here, we investigate the allergenicity and T cell reactivity of Mus m 1-Y120A and Mus m 1-Y120F, two mutants of Mus m 1 [43], a recombinant native isoform of the MUP ensemble (UniProtKB accession No. P11589) and we demonstrate that Y120A mutation accounts for conformational modifications of the overall protein architecture that impair recognition by patients’ IgE molecules while preserving critical T cell epitopes.
Material and Methods
Ethics Statement
Written informed consent was obtained from each participating subject according to the specific requirements of the Ethic Committee for studies which requires blood sampling. In particular, the protocol for the management of the Biological Bank for Immunological and Allergological studies was applied (San Raffaele Hospital, Ethic Committee, protocol code BBI-ALL, date of first approval May 5, 2005).
Subjects
Four subjects allergic to mouse allergens were included in this study. They all suffered from immediate-type symptoms, one of them also of delayed-type bronchial constriction in the 4–12 h following allergen exposure, as assessed with auscultation and spirometry. Moreover, they all suffered from exposition-dependent conjunctivitis. They had no other known sensitizations to common airborne allergens, except one of them who had low serum IgE titers to house dust mite (Dermatophagoides pteronissynusand farinae: 0.53 and 0.98 kU/l, respectively, determined by the ImmunoCap assay from Phadia, Uppsala, Sweden). Diagnosis of sensitization to mouse urine was confirmed with the determination of serum-specific IgE levels to mouse urinary proteins (range 7.6–21.4 kU/l, cutoff 0.35 kU/l). Four non-mouse-allergic adult subjects were used as controls, who displayed levels of specific IgE to grass pollen (Phleum pratense) ranging from 4.8 to 32.8 kU/l.
Allergens
Recombinant Mus m 1 and the two mutants (Mus m 1-Y120A and Mus m 1-Y120F) were produced in Pichia pastorisand purified as described by Ferrari et al. [43]. Mus m 1 was previously indicated as rMUP [43, 44, 45]. All proteins turned out to be soluble and stable over time. Gel chromatography has been used to verify the absence of aggregation (data not shown). Recently, the International Union of Immunological Societies, Allergen Nomenclature Sub-Committee has classified this protein as a new isoform variant of the isoallergen Mus m 1.0101, under the name of Mus m 1.0102.
Three 15-mer synthetic peptides, derived from the primary sequence of Mus m 1 (Mus m 1114–128, FQLMGLYGREPDLSS), Mus m 1-Y120A (Mus m 1-Y120A114–128, FQLMGLAGREPDLSS) and Mus m 1-Y120F (Mus m 1-Y120F114–128, FQLMGLFGREPDLSS) were used for the proliferation assays of peripheral blood mononuclear cells (PBMC) from mouse-allergic individuals. They were selected to include the predicted anchor residue for MHC binding (position 116), identified by loading the Mus m 1 sequence into the PROPRED MHC class II binding peptide prediction server [46], which is based on the TEPITOPE algorithm [47]. A peptide derived from the irrelevant human FcεRI (α-chain) (FcεRI240–254, RKGFRLLNPHPKPNP) was included as a negative control (Swiss-Prot entry P12319).
Circular Dichroism and Fluorescence Measurements
The proteins used for circular dichroism (CD) and fluorescence spectroscopy were dissolved in 10 mM Tris buffer pH 7.2 and each sample’s concentration was determined by the microbiuret assay. CD and emission fluorescence spectra were recorded using a JASCO J715 spectropolarimeter and a JASCO FP-6200 spectrofluorometer (PanVera, Madison, Wisc., USA), respectively, both equipped with a temperature-controlled single cell holder. All measurements were performed at 20°C.
For fluorescence experiments a 1-cm path-length quartz cell was used, with protein concentration in the range of 2.5–5.0 µM, giving an absorbance no greater than 0.1 OD. Tryptophan fluorescence was monitored by exciting at 295 nm, and with a bandwidth of 5 nm on both monochromators. The emission spectra were recorded over a range of 300–550 nm.
Far-UV CD spectra were recorded in the region 190–250 nm using a 0.2-cm path-length cell. Near-UV CD spectra were recorded over a 250- to 320-nm range using a 1-cm path-length cell. Protein concentration was 2 and 20 µM, for far- and near-UV CD spectra, respectively. Three runs for each experiment were acquired and averaged to achieve appropriate signal-to-noise ratios. The data are expressed as the mean residue molar ellipticity (degrees cm2 dmol–1), calculated using a mean residue weight of 115.
Determination of Allergenicity
Reverse Enzyme Allergen Sorbent Test
This assay was developed along the line of the original work of the late Paolo Falagiani [48]. Reverse enzyme allergen sorbent test (REAST) was used on the basis of two considerations: (1) it did not require absorption of allergen to solid phase, a procedure which may impair protein conformation, and (2) it allowed to express the level of specific IgE in absolute terms, in comparison with a standard containing total IgE in known amount. Both reasons are particularly relevant to this study, where subtle differences in titers and fine specificities are crucial to the interpretation of binding experiments. Briefly, a human IgE-specific polyclonal antibody (Sigma, Milan, Italy) was coated (10 µg/ml) overnight at room temperature in phosphate-buffered saline (PBS) on a 96-well ELISA plate (Corning Costar, PBI International, Milan, Italy). Nonspecific binding was blocked with bovine serum albumin (BSA, 10% in PBS). Undiluted serum was added followed by biotinylated allergen. The amount of specific IgE was measured as binding to alkaline phosphatase-conjugated streptavidin (2 µg/ml; Sigma) in PBS. The readout was performed at 405 nm with a spectrophotometer (Titertek, Huntsville, Ala., USA) after addition of the alkaline phosphatase substrate (Sigma). Washing between each step was carried out using PBS containing 0.05% Tween-20.
Total IgE levels were measured using a biotinylated mouse anti-human IgE monoclonal antibody (5 µg/ml; Pharmingen, San Diego, Calif., USA) and the results were expressed with respect to a standard curve (in kU/l; Phadia).
Biotinylated allergens were prepared from recombinant proteins and from a raw urine mouse allergen extract (courtesy of Domingo Barber, ALK-Abellò, Madrid, Spain) as follows. Proteins (2 mg/ml) were dialyzed against 50 mM sodium carbonate buffer, pH 9.2. Primary amines were engaged by N-hydroxysulfosuccinimide ester-modified biotin (NHS-Biotin; Sigma). A weight ratio of NHS-Biotin to allergen of 25:1 was used for 2 h at room temperature. Nonreacted biotin was removed by extensive dialysis against PBS. Optimal biotinylated allergen concentration was assessed by REAST experiments where MUP2 binding was evaluated in parallel in sera from the 4 mouse-allergic and the 4 control individuals. An allergen concentration of 1 µM was used as the most efficient in discriminating these two conditions (data not shown).
For the determination of the absolute amount of allergens-specific IgE, specific IgE levels were preliminarily calculated for each serum as the ratio between the background-subtracted optical density of the sample with biotinylated allergen over the background-subtracted optical density of total biotinylated mouse anti-human IgE. Allergen-specific IgE levels were extrapolated on the basis of the known amount of total IgE in each serum.
Western Blot
Electrophoresis of Mus m 1 was performed under nonreducing conditions in 10% sodium dodecyl sulphate polyacrylamide gel electrophoresis (SDS-PAGE). Coomassie blue staining was used to visualize protein concentration loaded in each lane. Proteins were transferred to a nitrocellulose membrane (Hybond ECL; Amersham Pharmacia Biotech, Piscataway, N.J., USA) and 1:5 diluted sera (0.5 ml) containing Mus m 1-specific IgE were individually reacted for 60 min at room temperature with the proteins blotted onto single strips. IgE detection was performed with the same volumes of HRP-conjugated rabbit anti-human IgE (DAKO Italia, Milan, Italy). Bound antibodies were revealed by enhanced chemiluminescence autoradiography (ECL; Amersham Pharmacia Biotech).
Basophil Degranulation Assay
Primary basophil degranulation was measured using the CAST®FLOW assay (Bühlmann, Schönenbuch, Switzerland), which is based on the detection of CD63 upregulation on IgE-positive cells with defined physical characteristics. Peripheral blood basophils were obtained from dextran gradient-enriched leukocytes of mouse-allergic individuals. The assay was performed according to the manufacturer’s instructions and the results were analyzed using a FACScan cytometer equipped with a Cell-Quest software (Becton-Dickinson Italia SPA, Buccinasco, Italy). Background (spontaneous) degranulation values were subtracted from each data point.
Rat Basophilic Leukemia Degranulation Assay
The use of passively sensitized rat basophilic leukemia (RBL) cell for comparing the potency of difference allergens has been extensively exploited, as a model particularly suitable to generate standardized results [49, 50]. Here, RBL cells were grown in RPMI medium, supplemented with 10% (v/v) FCS (Gibco-Invitrogen Corporation Italia, Milan, Italy) or autologous plasma. RBL-SX38 cells (a kind gift by M.H. Jouvin and J.P Kinet, Department of Pathology, Beth Israel Deaconess Medical Center and Harvard Medical School, Boston, Mass., USA.), stably expressing human FcεRI α-, β- and γ-chains [51] were cultured in complete medium supplemented with 800 µg/ml Geneticin (Sigma), as previously described [52].
The release of β-hexosaminidase was monitored as described [53], with minor modifications. Briefly, P-NAG (p-nitrophenyl-N-acetyl-β-D-glucosaminide; Sigma) in 0.1 M citrate buffer (pH 6.2) was added to RBL-SX38 cell supernatants and incubated at 37°C for 120 min. The reaction was terminated using 0.1 M carbonate buffer (pH 10) and the absorbance read at 405 nm. The supernatant of nonstimulated cells was considered as a negative control. The maximal stimulation was determined as previously described [54]. Briefly, 100 ng of 4-hydroxy-3-nitro-phenacetyl (NIP)- BSA (stoichiometric ratio NIP:BSA >10; Biosearch Technologies, Vacaville, Calif., USA) was used as an IgE cross-linker, by reacting it with RBL-SX38 cells pre-incubated with a commercially available human recombinant IgE anti-NIP monoclonal antibody [55] (Serotec, Milan, Italy). Negative control values consistently fell in a 15–25% range of the total β-hexosaminidase content, assessed from the 0.05% Triton X-100 (Sigma) lysate of the cell monolayer. The results were calculated as percent of β-hexosaminidase release according to the following equation: [100 × (A405 nm sample – A405 nm negative control)/(A405 nm maximal stimulation – A405 nm negative control)].
T Cell Proliferation Assays
Cell preparations containing allergen-specific T lymphocytes were obtained from PBMC isolated, by standard gradient separation (Ficoll Hypaque, Pharmacia, Stockholm, Sweden), from heparin-treated blood drawn by venipuncture in the forearm. Cells were seeded in 96-well flat-bottom plates (Corning Costar, PBI International) and cultured (200.000 PBMC per well in 200 µl culture volume) for 5 days in the presence of medium only (negative control) or allergens (Mus m 1, Mus m 1-Y120A, Mus m 1-Y120F; 5 µg/ml). Tritiated thymidine (3H-TdR; Dupont, Milan, Italy) was added (1 µCi per well) in the last 6–18 h of culture. Cells were harvested with a FilterMate Universal Harvester (Perkin Elmer Life Sciences, Boston, Mass., USA) and incorporated thymidine, expressed as counts per minute, was used as a measure of allergen-specific cell proliferation (TopCount NXT microplate scintillation and luminescence counter; Perkin Elmer Life Sciences). All assays were carried out in quadruplicate and mean values were used for calculation.
For the proliferation experiments with synthetic peptides, T cell lines were derived by stimulating PBMC with 5 µg/ml MUP2 for 7 days. In the last 2 days recombinant IL-2 (10 IU/m) was added. Cells were then harvested, starved of IL-2 for 24 h and restimulated for 2 days with autologous 2500-Rad irradiated PBMC (100,000 per well) as a source of antigen presenting cells, in the presence of 20 µg/ml peptide. The starving procedure allowed reducing the background proliferation (that is, in absence of allergen) in the secondary stimulation, as previously reported [56]. Tritiated thymidine was added (1 µCi per well) in the last 6–18 h of culture and tritium incorporation was measured as reported above.
Generation of MUP2-Specific T Cell Clones and Characterization of Their Cytokine Profiles
In order to derive Mus m 1114–128 epitope-specific T cell clones from Mus m 1-specific T cell lines, the latter were cloned as described [56, 57]. One T cell clone (TCC-34), which was CD4 positive and had lymphokine profiles compatible with a Th2 phenotype (not shown) was chosen for further experiments on the basis of high specific proliferation indexes both to the native sequence peptide and to the native Mus m 1 protein. Dose-response titration of TCC-34 reactivity to Mus m 1, Mus m 1-Y120A, Mus m 1-Y120F and peptides was determined in 48-hour proliferation assays performed using T cells from clone TCC-34 and 3,000-rad-irradiated autologous PBMC as antigen-presenting cells in a 1:2 ratio. In order to characterize the phenotype of T cell clones, supernatants were taken just before harvesting cells (for measuring proliferation) and frozen at –80°C for analysis of IL-4, IL-5 and interferon-γ. Sandwich ELISA assays were used with proper combination of capture/detection monoclonal antibodies specific to each cytokine (BD Biosciences, Heidelberg, Germany), according to the manufacturer’s instruction. The detection range of each assay was 16–2,000 pg/ml.
Statistical Analysis
Results were expressed as means ± SD. Differences between groups were examined for statistical significance using the one-way paired t test: p < 0.05 were considered statistically significant.
Results
Conformational Analysis by CD and Fluorescence Spectroscopy
While the far-UV CD spectra (fig. 1a) reveal a common profile suggesting the presence of similar elements of secondary structure, the near-UV CD spectra (fig. 1b) indicate local structural modification involving the aromatic side chains of the two mutants. In fact, the observed minima at 278 and 281 nm, which reflect the contributions of the tyrosine residues, are well recognizable in the spectra of Mus m 1 and Mus m 1-Y120F, while the resolution is very poor for Mus m 1-Y120A. As for the band at 293 nm, commonly attributed to tryptophan side chain, it disappears in the spectrum of Mus m 1-Y120A. Overall, the data suggest that the selected mutations, and in particular Y120A, induce a spatial rearrangement of the aromatic side chains.

Spectroscopic measurements. a Far-UV CD spectra of Mus m 1 (–––––), Mus m 1-Y120F (– – –) and Mus m 1-Y120A (· · · · ·), cell path-length 0.2 cm. b Near-UV CD spectra of Mus m 1 (–––––), Mus m 1-Y120F (– – –) and Mus m 1-Y120A (· · · · ·). Cell path-length 1 cm; protein concentration 2 and 20 µM for far-UV CD and near UV CD, respectively, in 10 mM TrisHCl buffer, pH 7.2 at 20°C. c Fluorescence emission spectra of Mus m 1 (–––––), Mus m 1-Y120F (– – –) and Mus m 1-Y120A (· · · · ·) in 10 mM TrisHCl buffer, pH 7.2 at 20°C. Protein concentration ranged from 2.5 µM to 5 µM. Cell path length 1 cm, λexc 295 nm.
Spectroscopic measurements. a Far-UV CD spectra of Mus m 1 (–––––), Mus m 1-Y120F (– – –) and Mus m 1-Y120A (· · · · ·), cell path-length 0.2 cm. b Near-UV CD spectra of Mus m 1 (–––––), Mus m 1-Y120F (– – –) and Mus m 1-Y120A (· · · · ·). Cell path-length 1 cm; protein concentration 2 and 20 µM for far-UV CD and near UV CD, respectively, in 10 mM TrisHCl buffer, pH 7.2 at 20°C. c Fluorescence emission spectra of Mus m 1 (–––––), Mus m 1-Y120F (– – –) and Mus m 1-Y120A (· · · · ·) in 10 mM TrisHCl buffer, pH 7.2 at 20°C. Protein concentration ranged from 2.5 µM to 5 µM. Cell path length 1 cm, λexc 295 nm.
As W19 is the only tryptophan residue in the protein, the analysis of its intrinsic fluorescence provides useful information to investigate the conformational events that take place in its vicinity. The fluorescence maximum of Mus m 1 is centered at 338 nm, as expected for a tryptophan partially buried in the hydrophobic pocket of the protein (fig. 1c), as expected for a tryptophan in a relatively hydrophobic environment [58].
Both mutations affect the position of the fluorescence maximum producing a progressive red shift that, in the case of Mus m 1-Y120A, is up to 5 nm, positioning the maximum at 343 nm (fig. 1c). This result indicates that the tryptophan side chain experiences a different electrostatic environment. Moreover, both mutants are characterized by an increase in fluorescence intensity, estimated in 25% for Mus m 1-Y120A and 17% for Mus m 1-Y120F. To justify the increase of fluorescence quantum yield we analyzed both the three-dimensional crystal structure (PDB 1JV4) and the NMR-derived solution structure (PDB 1DF3) of Mus m 1 [44, 45], and we found a close contact between W19 indole ring and R122 side chain. Indeed, using the program CaPTURE (http://capture.caltech.edu) we detected the existence of a cation-π interaction involving the pair W19/R122 (fig. 2) with an electrostatic energy Eelectrostatic = –3.49 kcal/mol. Noteworthy, this aromatic-amine interaction represents a conserved structural motif in the lipocalin superfamily [59]. In Mus m 1, it acts as an internal quenching mechanism that, due to the conformational rearrangement of the side chains induced by Y120 substitution, as revealed by the near-UV CD spectra, is expected to be altered. Thus, we conclude that the increased fluorescence emission, detected for the mutants, can be ascribed to a reduction of that intramolecular quenching mechanism.
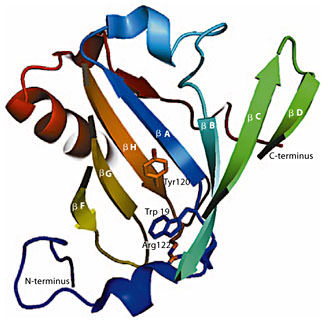
Schematic representation of the cavity of Mus m 1 crystal structure (1JV4, displayed in topology cartoon): W19 is visible at the bottom of the hydrophobic cavity of the β-barrel. The tryptophan side chain is predicted to form a cation-π interaction, deemed energetically significant by the CaPTURE web server, with the atoms belonging to residue R122. The proximity of these interacting residues to Y120 is appreciable; the side chains of the cited residues are represented in sticks.
Schematic representation of the cavity of Mus m 1 crystal structure (1JV4, displayed in topology cartoon): W19 is visible at the bottom of the hydrophobic cavity of the β-barrel. The tryptophan side chain is predicted to form a cation-π interaction, deemed energetically significant by the CaPTURE web server, with the atoms belonging to residue R122. The proximity of these interacting residues to Y120 is appreciable; the side chains of the cited residues are represented in sticks.
Overall, our data confirm the critical structural role of residue Y120 [22, 23] and, in particular, they show that Y120A single-point mutation leads to a perturbation of the aromatic residues environment.
Differential IgE Recognition
In vitro Immunochemistry Assays (REAST and Western Blot)
In vitro binding of serum IgE from mouse allergic individuals to wild-type and mutated Mus m 1 was tested by REAST and the measured amounts were related to a standard serum of known IgE concentration. The average binding activity of IgE towards Mus m 1 was 21.51 ± 9.96 kU/l, which diminished to 7.21 ± 3.88 (p = 0.0225) and 15.09 ± 8.87 kU/l (p = 0.0273) with MUP2-Y120A and MUP2-Y120F, respectively. IgE binding activity to mouse extract was 29.14 ± 15.94 kU/l (not significant vs. Mus m 1). Consistent results were obtained by immunoblotting. The three purified recombinant proteins (Mus m 1, Mus m 1-Y120F and Mus m 1-Y120A) were migrated by SDS-PAGE and either stained with Coomassie blue (fig. 3, left panel) or transferred onto nitrocellulose (fig. 3, right panel). Incubation of the membrane with sera from Mus m 1-sensitized patients (B and C are shown as the only two sera which gave measurable results), to probe the presence of bound IgE with HRP-conjugated anti-human IgE, was instrumental to visualize differences in IgE recognition. The results qualitatively demonstrate a weaker binding to the mutants as compared to Mus m 1 (fig. 3, right panel), particularly in the case of Mus m 1-Y120A. It is also interesting to note that, in the case of serum from donor B (but not from donor C), the IgE binding signal to Mus m 1-Y120F was almost identical to binding to Mus m 1. Since the tests were carried out using polyclonal sera, these results likely indicate that a different repertoire of fine specificities to the native allergen may differentially affect the efficiency of binding to Mus m 1 mutants.

Immunoblot analysis of wild-type and mutated MUP2. Equal amounts of Mus m 1, Mus m 1-Y120A and Mus m 1-Y120F were run on SDS-PAGE, stained with Coomassie blue (left panel) or transferred to nitrocellulose (right panel). Blotted proteins were singularly reacted with sera containing Mus m 1-specific IgE from each of the two individuals allergic to the Mus m 1.0101 isoallergen (B and C) or with the serum from a subject sensitized to grass allergen (control). Numbers on the y-axis indicate molecular weight markers in kDa.
Immunoblot analysis of wild-type and mutated MUP2. Equal amounts of Mus m 1, Mus m 1-Y120A and Mus m 1-Y120F were run on SDS-PAGE, stained with Coomassie blue (left panel) or transferred to nitrocellulose (right panel). Blotted proteins were singularly reacted with sera containing Mus m 1-specific IgE from each of the two individuals allergic to the Mus m 1.0101 isoallergen (B and C) or with the serum from a subject sensitized to grass allergen (control). Numbers on the y-axis indicate molecular weight markers in kDa.
In vitro Functional Tests of IgE Reactivity (Degranulation of Primary and Cell Line Basophils)
Mus m 1 and its mutants were added at various concentrations to peripheral blood basophils from mouse-allergic individuals and the expression of CD63 on basophil cell surface was determined by flow cytometry analysis. Basophils were identified by means of physical parameters and by the presence of FcεRI-bound IgE. We observed that, at the lowest tested protein concentration (80 nM), Mus m 1 induced a significantly higher basophil degranulation only with respect to Mus m 1-Y120A (p = 0.01), while, at the highest protein concentration tested (400 nM), Mus m 1 induced a higher extent of basophil degranulation with respect to both Mus m 1-Y120F and Mus m 1-Y120A (p = 0.01 for both; fig. 4). In this last case, degranulation induced by Mus m 1-Y120A was lower (though statistically not significant), when compared to Mus m 1-Y120F.

Degranulation assays. The average values of degranulation triggered by recombinant allergens have been measured as percentage of CD63+ (IgE+) cells in four patients and are shown as columns on the y-axis, where vertical bars indicate the standard deviation of the distribution of these values. The two concentrations of allergens used in this test, are shown in the x-axis. Vertical bars represent SD of distribution.
Degranulation assays. The average values of degranulation triggered by recombinant allergens have been measured as percentage of CD63+ (IgE+) cells in four patients and are shown as columns on the y-axis, where vertical bars indicate the standard deviation of the distribution of these values. The two concentrations of allergens used in this test, are shown in the x-axis. Vertical bars represent SD of distribution.
The FcεRI-dependent, IgE-mediated, degranulation was also quantified with a RBL cell line permanently transfected with human FcεRI (RBL-SX38). Cells were preliminarily reacted with serum from mouse-allergic individuals (as allergen-specific IgE sources) and subsequently with Mus m 1, or one of the mutants, in order to compare the FcεRI-dependent degranulation trigger they provided. There was a relevant interindividual variability in the degranulation induced by passive sensitization of the 4 tested subjects, likely due to differences in the repertoire of IgE antibodies to the Mus m 1 allergen in terms of fine specificity and affinity (fig. 5). The capability to trigger degranulation of RBL cells was also extrapolated as the protein concentration capable to induce the 50% of the maximum release and is shown in table 1. Note that, also in this case, Mus m 1-Y120A degranulation capability was lower than that of Mus m 1-Y120F. Although no straightforward correlation can be deduced between these results and those obtained with IgE-binding assays [60], they confirm also in functional terms that the tested mutants are recognized with lower efficiency than the wild-type molecule.
Mediator release induced by wild-type and mutant Mus m 1


IgE-mediated degranulation of human FcεRI-expressing RBL-SX38 cells reacted, in vitro, with sera from 4 mouse-allergic individuals (patients A–D) and challenged with native Mus m1 and its mutants. Degranulation was measured as percent of maximum β-hexosaminidase release (on the y-axis of each panel) upon incubation with different antigen concentrations (on the x-axis of each panel). Antigens are indicated in the legends.
IgE-mediated degranulation of human FcεRI-expressing RBL-SX38 cells reacted, in vitro, with sera from 4 mouse-allergic individuals (patients A–D) and challenged with native Mus m1 and its mutants. Degranulation was measured as percent of maximum β-hexosaminidase release (on the y-axis of each panel) upon incubation with different antigen concentrations (on the x-axis of each panel). Antigens are indicated in the legends.
Preservation of T Cell Epitopes by Mus m 1 Y120 Mutants
In order to assess whether Mus m 1 Y120 mutants preserved the naturally occurring T cell epitopes and whether these epitopes were made available for antigen presentation, PBMC and T cells from the same 4 mouse-allergic individuals were challenged in in vitro proliferation assays. The average values of PBMC proliferation induced by Mus m 1 were similar to those observed with Mus m 1-Y120A and Mus m 1-Y120F (fig. 6, top panel).

Cell proliferation (as CPM, y-axis). a PBMC from 4 mouse-allergic individuals stimulated with Mus m 1 and its mutants (nil = no stimulus). b Mus m 1-specific T cell lines from 2 mouse-allergic individuals (A and B) stimulated with Mus m 1 and the Mus m 1 15-mer peptides indicated in the inset and with a negative-control peptide (FcεRI240–254). Columns represent the mean values and vertical bars are SD.
Cell proliferation (as CPM, y-axis). a PBMC from 4 mouse-allergic individuals stimulated with Mus m 1 and its mutants (nil = no stimulus). b Mus m 1-specific T cell lines from 2 mouse-allergic individuals (A and B) stimulated with Mus m 1 and the Mus m 1 15-mer peptides indicated in the inset and with a negative-control peptide (FcεRI240–254). Columns represent the mean values and vertical bars are SD.
Due to differences in T cell activation efficiency, only in two patients allergen-specific T cell lines could be derived by a preliminary stimulation with Mus m 1. Those cells were then challenged with three 15-mer peptides corresponding to the predicted immunodominant linear epitope and including either Y120 or one of the two mutations (Y120F, Y120A). We found that the three peptides produced similar T cell responses (fig. 6, bottom panel). Taken together, these results indicate that the mutation inserted within that T cell epitope does not impair neither Mus m 1 processing by the antigen-presenting cells nor the presentation and T cell receptor recognition by allergen-specific T cells.
In order to further evaluate the influence of mutations on antigen processing and presentation, we exploited one Mus m 1114–128-specific, CD4 positive, Th2-type T cell clone (TCC-34), which we were able to derive only from the Mus m 1-specific T cell line of patient A. TCC-34 was tested for reactivity to Mus m 1, Mus m 1-Y120A and Mus m 1-Y120F (fig. 7, top panel), which requires antigen processing, and to peptides Mus m 1114–128, Y120A114–128 and Y120F114–128 (fig. 7, bottom panel), which does not. The results confirmed that, in the dose range tested, the introduction of the selected mutations did not affect the efficiency of either antigen processing or presentation. Lymphokines produced by TCC-34 following stimulations with each recombinant allergen or peptide at the highest tested concentration (20 and 50 µg/ml for antigens and peptides, respectively) were compatible with a Th2 phenotype (table 2).
Lymphokine profile of T cell clone TCC-34

Proliferation of Mus m 1 specific T cell clone TCC-34. Proliferation was measured as 3H-TdR incorporation and expressed as cpm (on the y-axis). Antigens (a) and peptides (b) were used for stimulation at concentrations shown on the x-axis, as indicated in the legends.
Proliferation of Mus m 1 specific T cell clone TCC-34. Proliferation was measured as 3H-TdR incorporation and expressed as cpm (on the y-axis). Antigens (a) and peptides (b) were used for stimulation at concentrations shown on the x-axis, as indicated in the legends.
Discussion
Mus m 1 belongs to the lipocalin superfamily and is one of the most important allergens for mouse allergic patients [7]. In recent years, Mus m 1 received considerable attention as a model system to unveil structural and energetic features of protein-ligand interaction and the mutation Y120F has been found to alter the protein binding activity [21, 22, 23, 24]. Along this line, we found that, also for the recombinant native isomer Mus m 1 [43], the two mutants Mus m 1 -Y120A and Mus m 1 -Y120F have a reduced ability to bind various types of ligands [A. Spisni, unpubl. results].
As for any allergen, it is expected that Mus m 1 pathological activity crucially depends on its structural integrity [61]. Thus, seeking a hypoallergenic form of this allergen, we analyzed the three-dimensional structure of Mus m 1 [44, 45] starting from the region neighboring Y120. Interestingly, Mus m 1 binding cavity presents an ensemble of nonpolar side chains surrounding the Y120 side chain, that turns out to be the only hydrogen bond donor group in the protein pocket. In addition, the analysis showed a number of clusters formed by highly conserved residues. One of them, formed by the triad G17, W19 and R122, and located near the pole of the cavity (fig. 2), suggested that the substitution of Y120 might impair its stability and, as a consequence, destabilize also the protein architecture; thus justifying the observed alteration of the binding activity of native Mus m 1 isoforms mutated in Y120 [[25], A. Spisni, unpubl. results]. On the basis of this rationale, and recognizing that a reduced allergenicity may be associated to a perturbed conformation [29, 31] we have been prompted to study the structural and allergenic features of two Mus m 1 mutants: Mus m 1-Y120F where we only perturbed the intracavity network of hydrogen bonds, and Mus m 1-Y120A, where, by significantly reducing the side chain steric hindrance, we expected to induce a ‘hollow’ inside the protein core.
The far-UV CD spectra revealed that for both mutants the secondary structure did not change appreciably with respect to the native protein. In contrast, the near-UV CD spectrum of Mus m 1-Y120A showed a significant perturbation of the spatial arrangement of the aromatic residues and especially of W19, as confirmed by the intrinsic fluorescence measurements that indicate a spatial repositioning of that residue inside the protein cavity.
Overall, the data indicated that substitution of Y120 with a small side chain residue considerably perturb the ensemble of noncovalent interactions expected to contribute to the stabilization of the protein architecture.
Indeed, preliminary pH-induced unfolding experiments, using 8-anilino-1-naphthalene sulfonate as a probe (data not shown), highlighted that, differently from Mus m 1, Mus m 1-Y120A does not expose to the exterior hydrophobic residues even at extremely low pH (pH 1), thus suggesting that the mutation induces modifications in the protein hydrophobic core. With this vision in mind, it was reasonable to foresee an alteration of the protein surface topography and most likely of its molecular recognition performance.
The in vitro analysis of the allergenicity of both mutants showed a reduced IgE binding, thus indicating they selectively lost conformational (B cell) epitopes. The possibility that the reduced IgE binding of Mus m 1-Y120A and Mus m 1-Y120F could be due to aggregation processes favored by the exposition of hydrophobic patches on the protein surface was discarded by the absence of 8-anilino-1-naphthalene sulfonate binding at physiological pH (data not shown).
In conclusion, these results indicate that Mus m 1 Y120 mutations produce alterations of conformation-dependent epitopes identified by Mus m 1-specific IgE.
An ideal vaccine for desensitization ought to be immunogenic, while being nonallergenic [62, 63]. In order to evaluate the mutants’ immunogenicity, the proliferation of T lymphocytes from allergic individuals induced by the two mutants was compared with the proliferation induced by Mus m 1. We found a virtually identical T cell reactivity for all tested proteins, suggesting that mutations did not impair immunogenicity. Notably, in a single patient, Mus m 1-Y120A and Mus m 1-Y120F were even more efficient than Mus m 1 in eliciting T cell proliferation. This may indicate that antigen processing of the mutants is facilitated. Although this is an anecdotal observation, it is tempting to speculate this result may reflect a change in the conformational flexibility of the mutants’ epitopes regions. Indeed, results obtained by Manca et al. [64] showed higher scores for in vitro T cell proliferation assays performed with partially denatured protein antigens, as compared to the intact ones. Further studies are needed to evaluate this point.
In silico analysis of Mus m 1 performed with the TEPITOPE algorithm [47], spotted a possible MCH class II anchor residue in position L116 as part of one T cell (linear) epitope spanning the sequence P114–S128. This epitope was predicted to bind most MHC class II alleles, that is, to be immunodominant in the general population. In addition, TEPITOPE predicted Y120 mutation as noninfluential in terms of immunogenicity, over a panel of 50 MHC class II allotypes [46]. We functionally evaluated this prediction by reacting T cell lines, raised in vitro with Mus m 1, with 15-mer peptides corresponding to the linear epitope expected to be generated by the processing of the native and mutated proteins: we verified if they could bind directly to MHC, on antigen-presenting cells, that is, if they were recognized by specific T lymphocytes. We found that Mus m 1-specific T lymphocytes could efficiently recognize both the native and the Y120-mutated linear epitopes. These results indicate that the Y120 mutation does not impair neither antigen processing (as indicated by the maintenance of T cell reactivity to antigens) nor antigen presentation (maintenance of epitope recognition). As a double-check, a Mus m 1114–128-specific CD4-positive, Th2-type T cell clone (TCC-34) was derived from the T Mus m 1-specific T cell line of patient A and tested, in a dose-dependent setting, for reactivity to Mus m 1, Mus m 1-Y120A and Mus m 1-Y120F as well as to peptides Mus m 1114–128, Y120A114–128 and Y120F114–128. The results confirmed that the introduction of the selected mutations did not affect the efficiency of antigen processing and presentation. Although several mouse antigens have been identified, including serum proteins, dander components and other urinary proteins [65], Mus m 1 is the most important allergen component in epidemiological terms [66]. Thus, in the perspective of designing patient-tailored immunotherapy, Mus m 1 will represent by far the most relevant component to be included in vaccines for mouse-allergic individuals.
In conclusion, our data support the notion that structure-guided strategies aimed to alter the allergen conformation and/or conformational dynamics, with the minimal impact on amino acid sequence, appear to be satisfactory for the production of modified allergens suitable for immunotherapy. Moreover, the knowledge of the three-dimensional structure of Mus m 1 combined with the possibility to obtain the NMR-derived structure of its variants emerges as a convenient model to study the structural rules of allergen-specific epitopes.
Acknowledgement
We thank the CIM of the University of Parma for the use of the CD spectropolarimeter.
