

Abstract
Background/Aims: The trabecular meshwork (TM) tissue is constantly exposed to dynamic stress caused by intraocular pressure (IOP). The effects of such biomechanical stress on the TM have not been analyzed. This study developed an animal model of fluctuating IOP and evaluated the effects of these fluctuations on TM tissue. Methods: To create fluctuation in the IOP, one eye of adult SD rats was exposed to cyclic stress with IOP fluctuation ranging from 5 mmHg to 45 mmHg at a 1/60 Hz frequency for 30 minutes every day for several weeks. The other eye was not treated and served as the control. Hematoxylin-eosin staining was used to evaluate changes in the ganglion cells and the morphology, thickness and density of the TM; immunohistochemistry was used to detect α-smooth muscle actin (α-SMA), laminin (LA) and fibronectin (FN) expression in the TM. Results: After several weeks of daily IOP fluctuation, the TM thickness remained unchanged, whereas the density dramatically increased. α-SMA, LA and FN were expressed in rat TM tissue, and the percentages of areas with positive expression significantly increased. The IOP was similar in the treated and control eyes and only tended to increase on day 22 of the experiment. Throughout the 28-day experiment, no ganglion cells were lost. Conclusions: Large fluctuations in IOP promoted the synthesis of α-SMA, LA and FN in the TM and increased the density of the TM, suggesting that fluctuations in IOP can induce pathological changes in the TM.
Introduction
Glaucoma is the second most common cause of blindness worldwide [1]. Elevated intraocular pressure (IOP) is believed to be a major risk factor for primary open-angle glaucoma (POAG), and the main therapies currently used for glaucoma focus on decreasing the IOP. The pathology responsible for ocular hypertension in POAG involves the abnormal accumulation of ECM proteins and the dysfunction of trabecular meshwork cells that increase resistance to the drainage of the aqueous humor through the trabecular pathway and impair outflow capacity. However, the mechanisms underlying the pathological changes in the trabecular meshwork are not well understood.
The TM consists of an irregular lattice of collagen beams, perforated sheets and extracellular matrix material (in the JCT) that is similar to an elastic sponge and lined with trabeculocytes. It bridges the sulcus between Schwabe's line and the scleral spur; Schlemm's canal (SC) is located on its outer edge, and the aqueous humor must pass through the TM before reaching the inner wall of Schlemm's canal. The JCT or/and SC inner wall endothelium are the sources of aqueous humor outflow resistance and regulate the IOP [2,3]. In the TM of POAG eyes, some extracellular matrix (ECM) proteins such as FN and LA are highly expressed and deposited, the trabecular collagen beams are thicker, and the spaces between the beams are decreased, which increases outflow resistance and leads to intraocular hypertension. Several factors, including cytokines (transforming growth factor, Wnt, connective tissue growth factor), lipid-derived compounds (prostaglandins), nucleosides (ATP/adenosine), and gases (nitric oxide), impact conventional outflow resistance to varying degrees [4]. However, what triggers the release of these factors is unknown.
In healthy eyes, the IOP varies dynamically during daily activities and follows a circadian rhythm [5]. Due to aqueous outflow and fluctuations in IOP, TM tissue experiences biomechanical stresses such as fluid shear stress, mechanical stretching and compression every day. During development and morphogenetic maintenance, mechanical stress is a critical regulator of cellular behavior, altering the functional and structural properties of tissues [6]. TM cells are pressure-sensitive cells [5,7] that experience mechanical stress throughout their lifetime. Several studies have shown that the short-term variations in IOP observed in glaucomatous populations are greater than those observed in normal populations [8]. We therefore speculated that large fluctuations in IOP were responsible for the pathological changes observed in the TM in glaucomatous eyes. To evaluate this hypothesis, we designed experiments to establish an in vivo model of fluctuating ocular hypertension with the goal of understanding the morphologic changes caused by fluctuations in IOP that occur in the TM over long periods of time.
Materials and Methods
General animal care and grouping
All of the experiments and procedures were performed in compliance with the ARVO statement for the Use of Animals in Ophthalmic and Vision Research and approved by the Chinese Government Committee for Animal Experimentation Ethics. Thirty adult SD rats of either sex weighing 220-240 g were obtained from the animal center (Daping Hospital and Research Institute of Surgery, Third Military Medical University, China). The animals were housed in clean cages containing pine shavings at a temperature of 21°C, and food and water were made freely available.
The 30 adult SD rats were sacrificed on day 7, 14 or 28 of the experiment (ten SD rats at each time point). One eye from each SD rat was randomly selected for the IOP fluctuation experiment (the IOP fluctuation group or F group); the other eye was left untreated (the control group or C group).
Ocular hypertension fluctuation model
The animals were deeply anesthetized with an intraperitoneal injection of sodium pentobarbital (60 mg/kg). Before inducing fluctuations in IOP, we measured the IOP of both eyes (Tono-Pen XL, USA). A pair of cross-action forceps with flat tips designed in the laboratory for this purpose (Fig. 1A) was placed at the nasal and temporal sides of the globe approximately 1 mm behind the limbus of the eye. To ensure adequate pressure to induce the biomechanical responses of the TM cells, we increased the peak value of the IOP to approximately 40 mmHg (35 mmHg-45 mmHg) by adjusting the distance between the two prongs of the forceps. The globe was clamped for 30 seconds (s) (Fig. 1B); meanwhile, the IOP was measured to confirm that it was between 35 mmHg and 45 mmHg. Then, the globe was relaxed for 30 s, and the IOP was measured again. This cycle of clamping and relaxing was repeated 30 times for a total of 30 minutes every day until the rat was sacrificed. During the experiments, if the IOP was lower than 35 mmHg during two consecutive clamping phases, the forceps were adjusted to increase the IOP to approximately 40 mmHg. All of the experiments were performed between 9:00 am and 11:00 am, and the cornea of the clamped eye was kept lubricated during the procedures.
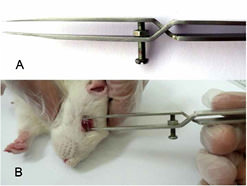
Photographs of the use of cross-action forceps on an anesthetized rat. A: A screw was installed 1.5 mm distal to the cross part and the space between the pincers could be adjusted with this screw. B: Cross-action forceps were placed at the nasal and temporal globe approximately 1 mm behind the limbus of the eye.
Photographs of the use of cross-action forceps on an anesthetized rat. A: A screw was installed 1.5 mm distal to the cross part and the space between the pincers could be adjusted with this screw. B: Cross-action forceps were placed at the nasal and temporal globe approximately 1 mm behind the limbus of the eye.
Histology
The SD rats were euthanized, and their eyes were enucleated 24 hours after the end of the experiment. The globes were immediately fixed overnight in a fixative consisting of formaldehyde, ethanol and acetic acid. A lateral incision measuring approximately one-quarter of the diameter of the eye was produced on the globe, and the crystalline lens was removed. The eye was subsequently dehydrated in a graded series of ethanol rinses, embedded in paraffin, cut into 4-μm sections and mounted on slides previously coated with polylysine.
The tissue slices were baked in an oven at 60°C for 2 h before being deparaffinized, rehydrated with an ethanol gradient and placed into 0.01 mol/L (pH 6.0) citric acid buffer for antigen retrieval. To block endogenous peroxidase activity, the slices were incubated with 3% hydrogen peroxide for 15 min and washed in phosphate-buffered saline (PBS). After preincubation with goat serum for 30 min at room temperature to block nonspecific binding, the sections were incubated overnight at 4°C with primary antibody (rabbit polyclonal anti-alpha SMA, ab5694, Abcam, USA, 1:200; anti-laminin α-1 [H-300], sc-5582, Santa, USA, 1:100; or anti-fibronectin [H-300], sc-9068, Santa, USA, 1:100), rewarmed at 37°C for 1 h and washed in PBS. An HRP detection system for rabbit primary antibody (Histostain™ - Plus Kits, ZYMED, USA) was used to detect the rabbit IgG according to the supplier's instructions. HRP activity was revealed by DAB. All of the sections were lightly counterstained with hematoxylin. PBS was substituted for the primary antibody in the negative controls.
Measurements
The positively stained areas of the immunohistochemically stained tissue section images and the thickness and density of the TM were quantified using Image-Pro Plus software (IPP, Media Cybernetics, Silver Spring, MD, USA), version 6.0. The area of interest (AOI) between the scleral spur and Schwabe's line was circled with a green line, and the brown area in the AOI (circled with a red line) was considered a positively stained region of the TM (Fig. 3); the amount of protein was expressed as a percentage of the positive area in the AOI (positive area/AOI). The density of the TM was calculated (1 - TM space area/AOI), and the thickness of the TM was expressed as the average thickness of the uveal meshwork, the midpiece and the corneoscleral meshwork. All measurements were performed by an observer who was blinded to the experimental conditions.

The treated eye (IOP fluctuation group) of an SD rat sacrificed on day 14. The eye was stained with DAB, and the brown area is LA positive. The positively stained area was measured using Image-Pro Plus software, version 6.0. The area of interest (AOI) was located between the scleral spur and Schwabe's line (the area outlined by the green line), and the area outlined by the red line was considered positively stained.
The treated eye (IOP fluctuation group) of an SD rat sacrificed on day 14. The eye was stained with DAB, and the brown area is LA positive. The positively stained area was measured using Image-Pro Plus software, version 6.0. The area of interest (AOI) was located between the scleral spur and Schwabe's line (the area outlined by the green line), and the area outlined by the red line was considered positively stained.
Statistical analysis
All of the data are expressed as means ± SDs. All of the comparative analyses were performed with paired-sample t-tests using SPSS statistical software (version 13.0 for Windows, SPSS Inc., Chicago, IL, USA). A p-value <0.05 was considered statistically significant.
Results
During the IOP fluctuation procedures, there were no observable signs of damage to the ocular globe. Mild edema and congestion were produced in the nasal and temporal conjunctiva. However, no bleeding was observed in the conjunctiva of any eye subjected to this procedure, and the conjunctiva appeared normal 24 hours after clamping. We also compared the morphological features of the TM sections at each time point between the control and IOP fluctuation groups. No acute injury features (e.g., hemorrhage, tear, rupture) [9,10] were found.
IOP
To confirm that the pressures were sufficient to induce stress in the TM cells during the IOP fluctuations, IOP measurements were obtained from the animals during both the clamping and relaxation phases of the experiment. The average IOP varied from 8.08 mmHg to 39.19 mmHg during the experiments. The frequency of IOP fluctuation was 1/60 Hz, and the cycle was characterized by a ratio of 1:1 (30 s higher, 30 s lower); the process lasted 30 minutes per day until the rat was sacrificed.
We also measured the IOP (pre-fluctuation IOP) of both eyes every day before the experimental procedure began, and the IOP value obtained in the fluctuation group consisted of the IOP measured 24 hours after the last IOP fluctuation experiment. The variation in pre-fluctuation IOP is shown in Figure 2B. The IOP in the fluctuation group appeared to return to normal levels within 24 hours of the last IOP fluctuation exposure. No significant differences in IOP between the fluctuation group and control group were observed at any time point; however, the IOP tended to be slightly elevated after day 22.

Graphs of the range of IOP during the experiment and throughout the experimental period before the fluctuations were initiated. A: The range of IOP fluctuations during the experiment in 30 minutes in a typical eye. The frequency of the fluctuations was 1/60 Hz, and the cycle was 1:1 (30 s high, 30 s low). B: The average IOP before the experimental procedure was performed. There were no significant differences in IOP between the two groups at any time point.
Graphs of the range of IOP during the experiment and throughout the experimental period before the fluctuations were initiated. A: The range of IOP fluctuations during the experiment in 30 minutes in a typical eye. The frequency of the fluctuations was 1/60 Hz, and the cycle was 1:1 (30 s high, 30 s low). B: The average IOP before the experimental procedure was performed. There were no significant differences in IOP between the two groups at any time point.
Density of ganglion cells
Retinal ganglion cells are pressure-sensitive cells, and ocular hypertension can result in the apoptosis of ganglion cells. To verify that the changes in the TM were not induced by ischemia/reperfusion injury caused by the fluctuation in IOP, the density of the ganglion cells in the retina was measured. On day 28, we randomly selected 30 slices from ten samples from each group, and three slices from each sample were analyzed. An area from the approximate midpoint between the optic nerve and the ciliary body was selected. The density of the ganglion cells in this area was not overly concentrated or overly thin. There were 32.40 ± 5.80 ganglion cells/600 μm segment of retina section in the IOP fluctuation-exposed eyes and 34.17 ± 4.96 cells/600 μm segment in the control eyes (Fig. 8). No ganglion cells were lost in the treated eyes (p=0.161).

Density of ganglion cells in the retina in a treated eye (A) and a control eye on day 28 (B). The regions shown are at the approximate midpoint between the optic nerve and ciliary body. The density of the ganglion cells was not significantly different between the two groups (C) (n=30, p=0.161). The arrows show ganglion cells, and the scale bar indicates 20 μm.
Density of ganglion cells in the retina in a treated eye (A) and a control eye on day 28 (B). The regions shown are at the approximate midpoint between the optic nerve and ciliary body. The density of the ganglion cells was not significantly different between the two groups (C) (n=30, p=0.161). The arrows show ganglion cells, and the scale bar indicates 20 μm.
Thickness and density of the TM
In control eyes, the collagen beams and perforated sheets of the TM resembled irregular lines loosely woven together (Fig. 4 A1-A3). In contrast, the beams and sheets became obviously thickened on day 7 (Fig. 5A1), and some had merged together (Fig. 5A2) on day 14 of the experiment. After 28 days of experimental treatment, the spaces between the trabecular beams were drastically decreased in size, and the TM showed dense, cord-like hypertrophy (Fig. 5A3). The thicknesses of the TM were 11.17±4.98 μm, 10.76±4.71 μm and 11.00±4.05 μm on days 7, 14 and 28 in the control group and 10.84±4.47 μm, 10.43±4.32 μm and 11.56±4.24 μm on days 7, 14 and 28, respectively, in the treated group (Fig. 7A); no significant differences in TM thickness were observed among groups. Although the thickness was not clearly altered, the density of the TM increased dramatically in the treated eyes. In the control group, the densities of the TM were 29.62%±5.12%, 31.78%±7.98% and 31.78%±7.98%, on days 7, 14 and 28, respectively; no significant differences were observed among the time points. In the treated eyes, the TM densities increased to 38.58%±9.72%, 57.59%±9.37% and 69.33%±12.31% on days 7, 14 and 28, respectively, and the differences between time points were statistically significant (Fig. 7B).

Photographs of TM morphology and the expression of α-SMA, LA and FN in control eyes. A1-A3 were stained with HE; B1-D3 show immunohistochemical images detected with DAB. B1-B3: α-SMA; C1-C3: LA; D1-D3: FN. HE staining shows the TM as several irregular lines that are loosely woven together; the areas of positive staining for α-SMA, LA and FN did not differ among time points. The arrows show TM tissue, and the scale bar indicates 20 μm.
Photographs of TM morphology and the expression of α-SMA, LA and FN in control eyes. A1-A3 were stained with HE; B1-D3 show immunohistochemical images detected with DAB. B1-B3: α-SMA; C1-C3: LA; D1-D3: FN. HE staining shows the TM as several irregular lines that are loosely woven together; the areas of positive staining for α-SMA, LA and FN did not differ among time points. The arrows show TM tissue, and the scale bar indicates 20 μm.

Photographs of TM morphology and the expression of α-SMA, LA and FN in eyes subjected to IOP fluctuation. A1-A3 were stained with HE; B1-D3 show immunohistochemical images detected with DAB. B1-B3: α-SMA; C1-C3: LA; D1-D3: FN. HE staining shows that the TM thickened by day 7, that some layers had merged together on day 14, and that cord like hypertrophy was present on day 28. Significant differences in LA and FN expression were observed at each time point; the size of the α-SMA-stained area was also significantly increased at each time point, except between day 14 and day 28. The arrows show TM tissue, and the scale bar indicates 20 μm.
Photographs of TM morphology and the expression of α-SMA, LA and FN in eyes subjected to IOP fluctuation. A1-A3 were stained with HE; B1-D3 show immunohistochemical images detected with DAB. B1-B3: α-SMA; C1-C3: LA; D1-D3: FN. HE staining shows that the TM thickened by day 7, that some layers had merged together on day 14, and that cord like hypertrophy was present on day 28. Significant differences in LA and FN expression were observed at each time point; the size of the α-SMA-stained area was also significantly increased at each time point, except between day 14 and day 28. The arrows show TM tissue, and the scale bar indicates 20 μm.

The thickness (A) and density (B) of the TM. There were no significant differences among the control groups. The thickness of the TM was similar for the control group and treated group at each time point; the density of the TM increased significantly with time. (* indicates p<0.05 vs. control; # indicates p<0.05 vs. day 7; ^ indicates p<0.05 vs. day 14).
The thickness (A) and density (B) of the TM. There were no significant differences among the control groups. The thickness of the TM was similar for the control group and treated group at each time point; the density of the TM increased significantly with time. (* indicates p<0.05 vs. control; # indicates p<0.05 vs. day 7; ^ indicates p<0.05 vs. day 14).
FN, LA and α-SMA
LA and FN are important components of the ECM, and α-SMA is a contractile protein; these molecules are expressed in the TM and participate in outflow resistance. To quantify the expression of LA, FN and α-SMA in the TM at each time point, we measured the positively stained area on three slices from each eyeball (a total of thirty slices for each time point) using Image-Pro Plus software, version 6.0. As the experiment proceeded, the size of the three positively stained areas increased significantly (Fig. 5). Significant differences in LA and FN expression were observed at each time point (Fig. 6B, 6C); the size of the α-SMA-stained area was also significantly increased at each time point, except between day 14 and day 28 (Fig. 6A).
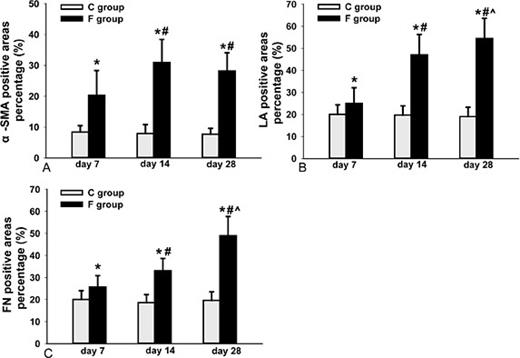
Percentages of α-SMA- (A), LA- (B) and FN- (C) positive areas in the TM. There were no significant differences among the control groups, The percentage of positive area significantly increased with time, except for the α-SMA-stained areas between day 14 and day 28 (* indicates p<0.05 vs. control; # indicates p<0.05 vs. day 7; ^ indicates p<0.05 vs. day 14).
Percentages of α-SMA- (A), LA- (B) and FN- (C) positive areas in the TM. There were no significant differences among the control groups, The percentage of positive area significantly increased with time, except for the α-SMA-stained areas between day 14 and day 28 (* indicates p<0.05 vs. control; # indicates p<0.05 vs. day 7; ^ indicates p<0.05 vs. day 14).
Discussion
The present study used modified cross-action forceps to clamp the eyeball and to induce fluctuations in IOP, thereby straining the TM tissue. In contrast to scenarios of static or cyclic mechanical stretching of the TM cells, it was difficult to measure the stress imposed upon single TM cells in this model because of the complexity of the trabecular meshwork in vivo; however, this method also offers several advantages. It is non-invasive and does not require surgery; it is extremely simple and easy to perform without sophisticated and lengthy training; and elevated IOP can be controlled by adjusting the distance of the forceps prongs. Most importantly, the procedure can be repeated for extended periods of time. The only apparent damage observed during the procedure was mild conjunctival edema and congestion that disappeared within 24 hours of the end of the clamping procedure. To confirm whether IOP fluctuation caused ischemia/reperfusion injury in the eyes, the density of ganglion cells in the retina was measured. There were no significant differences in the number of ganglion cells between the control eyes and the eyes subjected to the IOP fluctuation procedure (Fig. 8). We established that the observed changes in the TM were not caused by tissue damage and repair but were rather associated with an active response of the TM cells to the fluctuation in IOP.
FN and LA, two important components of the ECM of TM cells, are expressed in the outflow pathway and localized in the basement membranes of JCT and the SC inner wall [11,12,13,14]. Thus, these proteins have long been favorite hypothetical sources of outflow resistance. Morphologic studies in glaucomatous eyes have shown an increase in the accumulation of ECM in TM tissue, and increases in fibrillar material and sheath-derived plaques have also been observed [15,16]. In the present study, the eyes subjected to IOP fluctuation ranged from 8.08 mmHg to 39.19 mmHg (average), which was sufficient to stress the TM cells. We observed changes in the TM tissue and found that FN and LA expression in the TM increased significantly as the experiment proceeded. With the accumulation of FN and LA, the density (but not the thickness) of the TM increased dramatically, which might have contributed to the increased stiffness and flow resistance of the TM along the aqueous outflow pathway. These changes were similar to those found in glaucomatous TM tissues, and we therefore speculate that large fluctuations in IOP may be the original trigger for the pathological changes of the TM in glaucomatous eyes.
α-SMA is an isoform of α-actin that is expressed in mouse, rat, rabbit and human TM tissue [17] and participates in the regulation of resistance to aqueous humor. Interestingly, these contractile proteins have been characterized as mechanosensitive [18]. In the present study, we found that α-SMA was expressed in rat TM tissue and that the positively stained area was significantly larger in the treated eyes than in the control eyes. Previous studies have shown that mechanical stress, shear stress and ECM stiffness are important factors involved in activating Rho GTPase in different cell types [19,20,21] and that Rho GTPase can induce the synthesis of FN, LA and α-SMA in trabecular meshwork cells [22]. We speculated that the changes in α-SMA expression may have been induced by the Rho GTPase-mediated fluctuation in IOP. Although the amount of α-SMA on day 28 was not significantly higher than that observed on day 14 in this study, the excessive expression of α-SMA can reduce aqueous humor outflow, and α-SMA expression may maintain a bi-directional balance between regulation outflow resistance and ECM mechanical force.
IOP is an indicator of the balance in aqueous humor produced by the ciliary body and is removed via conventional and unconventional pathways; when the aqueous removal is less than the aqueous production, ocular hypertension occurs. In our study, we measured the IOP 24 hours after the IOP fluctuation experiments and found that the IOP in the treated eyes was similar to that in the control eyes. Even during the last several days of the experiment, only a trend toward a slightly elevated IOP was observed. The variation in IOP appeared to be inconsistent with the morphological character of the TM tissue. Several hypotheses can explain these outcomes. First, because the ultrafiltration component of aqueous humor formation is pressure sensitive [23], the elevated IOP might have reduced aqueous humor production in the IOP fluctuation experiment. Second, aqueous humor outflow consists of trabecular outflow and uveoscleral outflow; uveoscleral outflow, which accounts for 54% of the total aqueous drainage in young healthy human eyes and for 45-70% in young healthy monkey eyes [24,25], is less influenced by fluctuations in IOP than trabecular outflow. The ratio of trabecular outflow to uveoscleral outflow in rats might differ from that in humans. Third, because the IOP of both eyes was measured every day before the experiments, the measured IOP was taken 24 hours after the last IOP fluctuation experiment. The last average trough IOP was 8.08 mmHg, which is much lower than the normal value; as a result, the IOP may have needed more time to recover to its normal level. Moreover, the histological changes observed in the TM may not be sufficient to elevate IOP due to the existence of other outflow pathways. Increasing the amplitude of the IOP fluctuation or/and extending the time of the experiment must be performed to verify these hypotheses.
IOP fluctuations have detrimental effects in glaucomatous eyes, and much focus has been directed toward determining whether IOP fluctuation hastens the progression of glaucoma [26,27]; however, few studies have examined the effects of IOP fluctuation on TM tissue in vivo. In the present study, we established an IOP fluctuation model in SD rat eyes and observed morphological changes in the TM. These changes were similar to those observed in the TM in POAG, suggesting that large fluctuations in IOP may be one of the causes of glaucoma and that people who are subject to large fluctuations in IOP require more medical attention.
Acknowledgments
Professor Yuanguo Zhou kindly reviewed our manuscript and made constructive suggestions. We thank technician Jun Zhan (Pathology Laboratory, Daping Hospital, Third Military Medical University, Chongqing, China) for his technical assistance with the IHC experiments. This work was supported by funding from the National Natural Science Foundation of China (no. 81371006, no. 81000378).

