

Abstract
This study was conducted to see how orang-utans (Pongo pygmaeus wurmbii) were coping with fine-scale habitat disturbance in a selectively logged peat swamp forest in Central Kalimantan, Borneo. Seven habitat classes were defined, and orang-utans were found to use all of these, but were selective in their preference for certain classes over others. Overall, the tall forest classes (≥20 m) were preferred. They were preferred for feeding, irrespective of canopy connectivity, whereas classes with a connected canopy (canopy cover ≥75%), irrespective of canopy height, were preferred for resting and nesting, suggesting that tall trees are preferred for feeding and connected canopy for security and protection. The smaller forest classes (≤10 m high) were least preferred and were used mainly for travelling from patch to patch. Thus, selective logging is demonstrated here to be compatible with orang-utan survival as long as large food trees and patches of primary forest remain. Logged forest, therefore, should not automatically be designated as ‘degraded'. These findings have important implications for forest management, forest classification and the designation of protected areas for orang-utan conservation.
Introduction
There are many different findings concerning the effect habitat disturbance has on primate populations. Plumptre and Reynolds [1994] found that primates appear to be fairly flexible in their response to disturbance and are therefore not a good indicator of disturbance. Primate responses, however, vary depending on the level of disturbance. Early studies demonstrated that the orang-utan (Pongo pygmaeus), proboscis monkey (Nasalis larvatus) and many African primates were adversely affected by selective logging (the removal of a few large stems of selected species) [MacKinnon, 1971; Wilson and Wilson, 1975; Rijksen, 1978; Chapman et al., 2000], similar to findings from more recent studies in which orang-utan densities are reported to be higher in unlogged forest than in comparable logged forests [Davies and Payne, 1982; van Schaik et al., 1995; Russon et al., 2001; Morrogh-Bernard et al., 2003; Felton et al., 2003; Johnson et al., 2005; Husson et al., 2009]. Orang-utans typically respond to logging by moving away from affected areas, but will return once the disturbance has ended, although at lower densities [MacKinnon, 1974; Morrogh-Bernard et al., 2003; Ancrenaz et al., 2010]. Knop et al. [2004] found that orang-utan densities in a forest which was logged 22 years previously were not significantly lower than those in an unlogged forest nearby, suggesting that if an area is left for an extended period of time, densities will recover to pre-logging levels. In a study in Ulu Segama, Malaysia, Ancrenaz et al. [2010] found that orang-utan densities were maintained at pre-logging levels in areas which were lightly and sustainably logged, but declined in areas which were intensively logged.
Orang-utans prefer tropical lowland forests, but many of these are being converted to agriculture or have been degraded by past logging activities [Meijaard and Sheil, 2008]. In this way nearly all lowland forests in the orang-utan's range have been lost or degraded to some extent, even in National Parks [Nellemann et al., 2007]. The degree of damage to forest structure depends on the logging operation, with increased damage if the logging operation was unplanned and uncontrolled (illegal logging) [Johns et al., 1996, pers. observation; Felton et al., 2003]. In the study of Chapman et al. [2000] on the long-term effects of logging, primates persisted better in areas where low-intensity selective logging was conducted. This holds true for orang-utans [Morrogh-Bernard et al., 2003; Felton et al., 2003; Husson et al., 2009; Ancrenaz et al., 2010]. Thus, it is clear that orang-utans are able to survive in degraded forest, albeit at lower densities, indicating that degraded lands are important wildlife refuges and worthy of protection [Meijaard et al., 2005; Ancrenaz et al., 2010]. Unfortunately for conservation of these populations, most forests in Indonesia that have had some form of logging are classed as degraded, which paves the way for them to be allocated for conversion [Forest Watch Indonesia/Global Forest Watch, 2002]. To improve spatial planning policies, it is helpful to understand the factors that determine whether a degraded forest retains importance for species of conservation concern; thus, distinguishing between slightly degraded and badly degraded forests is important.
It is the speed and degree of forest damage together with an individual's ability to cope with these disturbances that determines whether primates can continue to survive in logged forests. In most selectively logged areas, it has been estimated that an area of 50 m radius is destroyed when a tree is felled [Asner et al., 2004]. Thus, forests become a patchwork with areas of different levels of disturbance at different stages of regeneration mixed together with patches of primary forest. Primates can continue to survive in these forests [Wilson and Wilson, 1975; Plumptre and Johns, 2001; Ancrenaz et al., 2004b; Marshall et al., 2006], but their survival depends on their ability to adapt to altered forest structure and species composition, especially their degree of dietary flexibility [Johns, 1997; Meijaard et al., 2005, 2008].
The effect of logging on orang-utan behaviour is still little understood. Rao and van Schaik [1997] showed that they became more folivorous and travelled more in logged compared to unlogged forest. The destruction of large trees removes potential food sources for most primates and reduces the availability of food, arboreal travel routes, nesting and sleeping places [Cannon and Leighton, 1994; Felton et al., 2003; Thompson, 2007], leading to changes in activity patterns [Johns, 1986; Cannon and Leighton, 1994; Thorpe and Crompton, 2005; Thompson, 2007]. The lar gibbon (Hylobates lar) and banded langur (Presbytis melalophos) increased their time resting and decreased their time feeding and travelling in logged forest [Johns, 1986]. Thus, adaptability is an important factor in an animal's ability to survive. For orang-utans, the Bornean species is more adapted to living in logged forests than the Sumatran species because their diet incorporates a larger proportion of less nutritious food, such as bark and leaves [Knott, 1999a; Taylor, 2006; Harrison, 2009]. Rode et al. [2006] found that the nutritional value of the red-tailed monkey's (Cercopithecus ascanius) diet was significantly reduced in heavily logged forest, emphasising the implications that logging can have on animal health [Gillespie et al., 2005]. When a forest is logged, the removal of large trees disrupts the upper canopy affecting travel routes and forcing arboreal species to descend to lower levels or even travel on the ground [Johns, 1986; Manduell et al., 2011]. This in turn can increase predation risks from terrestrial predators. Plumptre and Johns [2001] suggested that the density of L'Hoest's monkey (Cercopithecus lhoesti) may decline in logged forests because it forages mostly on the ground. Thus, changes in behaviour owing to disturbance affect species differently, with some being better at adapting than others.
Meijaard et al. [2008] identified two tolerance levels for animals exposed to disturbance: (1) intolerant animals - those which have narrow ecological niches and are mainly frugivorous, faunivorous, carnivorous or insectivorous - and (2) tolerant animals - mainly herbivorous or more ‘omnivorous' animals (forest generalists). Although orang-utans are considered to be mainly frugivorous, they can be flexible when required by including more barks and piths into their diet [Russon et al., 2009]. Thus, orang-utans, particularly the Bornean species, are reasonably tolerant of logging disturbance, with their presence being recorded at sustainable densities in logged habitat [Husson et al., 2009; Ancrenaz et al., 2010]. However, we know little about their behavioural responses to logging, and almost nothing about their fine-scale habitat use.
In this study we investigate habitat use in relation to fine-scale levels of logging disturbance by examining activity patterns in predefined habitat classes. We aim to identify those elements of an intact forest that are important for maintaining natural behaviour and identify threshold levels at which disturbance becomes suboptimal for orang-utans, i.e. where their natural behaviour is changed or compromised. By examining fine-scale habitat use by individual orang-utans in a selectively logged forest, this study is in contrast to previous studies on orang-utan behaviour where populations are compared between logged and unlogged forests.
Methods
Study Site
Field research was carried out as part of the OUTROP-CIMTROP multidisciplinary research project within the Laboratorium Alam Hutan Gambut Natural Laboratory for the Study of Peat Swamp Forest, in the northern Sabangau Forest (fig. 1 - coordinates 2°19′ S and 114°00′ E), a 5,780 km2 protected tropical peat swamp forest in Central Kalimantan, Indonesia. Sabangau supports the largest contiguous population of Bornean orang-utan (P. pygmaeus), estimated at 6,900 individuals [Morrogh-Bernard et al., 2003; Singleton et al., 2004]. Sabangau remains unfragmented, yet was selectively logged from 1973 to 2005, the last 8 years of which was indiscriminate, illegal logging. There are 5 distinct habitat subtypes in Sabangau, varying in structure and vegetation composition according to peat depth, surface gradient and hydrology [Page et al., 1999]. This study was conducted in the largest of these habitat types, the mixed-swamp forest (approx. 3,300 km2 of the total forested area), which supports the majority of the orang-utan population [Morrogh-Bernard et al.,2003] and also experienced the most logging activity. At the time of this study, the research site was a fine-scale mosaic of primary, selectively logged and regenerating forest.
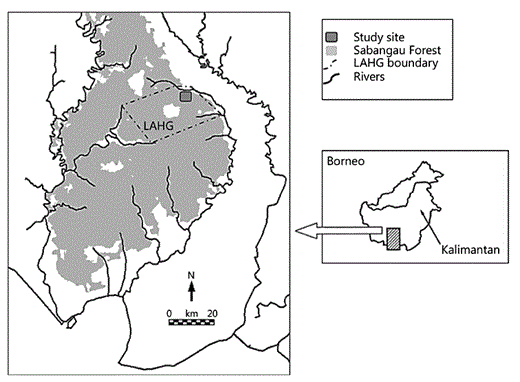
Study site location. LAHG = Laboratorium Alam Hutan Gambut: Natural Laboratory for the Study of Peat Swamp Forest.
Study site location. LAHG = Laboratorium Alam Hutan Gambut: Natural Laboratory for the Study of Peat Swamp Forest.
Behavioural Data
Data were collected between September 2003 and September 2005 on individual focal orang-utans using instantaneous sampling at 5-min intervals [Martin and Bateson, 1986; Morrogh-Bernard et al., 2002]. Data were collected on activity patterns (feeding, resting, travelling, nest-building and social), food type eaten (fruit, flower, leaves, bark, pith, invertebrates, other), mode of travel (climbing, clambering, tree-swaying, quadrupedal walking, brachiating) and party size (the number of independent orang-utans, i.e. not including dependent offspring, present within 50 m of each other).
Habitat Quality
In order to describe the habitat quality during the focal orang-utan follows, we devised a simple method for visually assessing forest structure rather than taking time-consuming measurements of habitat variables. Seven discrete ‘habitat classes' were defined, based on canopy height and connectivity (table 1, fig. 2). An eighth habitat class, ‘clearing', was initially defined but no orang-utan entered this class during the focal follows and the proportion of this class in the study area was negligible.
Description of the 8 habitat classes as originally defined

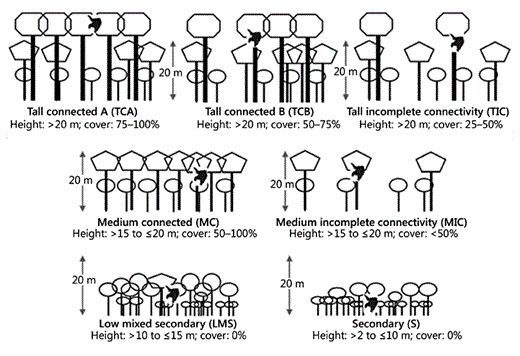
A stylised drawing of the 7 habitat classes used. Cover refers to cover at 20 m and above.
A stylised drawing of the 7 habitat classes used. Cover refers to cover at 20 m and above.
These habitat classes are a description of the forest structure and degree of disturbance and regeneration within a single habitat type (mixed peat swamp forest) and are therefore intended to be an indicator of the relative habitat quality. By classifying the forest in this way we can assess which structural factors are important for orang-utans. In its unlogged state this habitat type is relatively homogenous in character with abundant and evenly distributed fruit-providing trees [Page et al., 1999; Morrogh-Bernard, 2009]. The study area is flat with no hills or riverine habitat, no obvious clumping of food resources, no mast-fruiting and no major seasonal movements of orang-utans [pers. observation], and therefore separating this habitat into classes based only on structure and degree of disturbance is valid.
Habitat classes were assessed by eye during the focal follows, estimating canopy height and canopy connectivity (percent cover) in a 10-metre radius round the central point (i.e. the focal orang-utan). The habitat class was recorded at 5-min intervals at the same time as the behaviour data. This was a quick and efficient way to assess habitat quality while on the move.
Proportion of Each Habitat Class
In order to determine if orang-utans were using the habitat at random or selecting certain habitat classes in preference over others, we needed to determine the proportion of each habitat class present in the study area. We made a visual assessment of locations throughout the forest using the same method as during the follows. We surveyed 15 transects throughout the study area in which orang-utans were followed, 250 m apart from each other, running both east-west and north-south and totalling 26.1 km in length. Habitat quality was assessed visually by H.C.M.-B. at 50-metre intervals giving a total of 522 data points.
Habitat Measurements
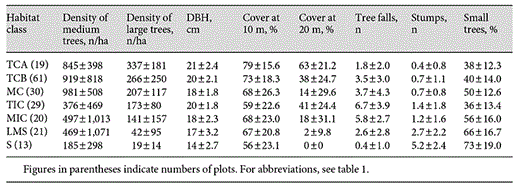
In order to test the hypothesis that our habitat classes reflected real differences in habitat quality, 193 locations were given a visual habitat quality classification by H.C.M.-B., and then a number of habitat variables were directly measured. Locations were initially selected at random, but for those habitat classes which were only represented by a few locations, we purposefully selected additional locations for measurement. Eight variables were measured and then averaged across plots to give a figure for each habitat class. These variables were:
- density of large trees (≥20 cm diameter at breast height, DBH) using the point-centred quarter method [Sutherland, 1996]; in each quarter the nearest tree of this size to the central point was selected and the distance from the centre of that tree to the central point measured;
- density of medium-sized trees (≥10 to <20 cm DBH) using the point-centred quarter method;
- tree size, represented by average DBH of the 8 trees selected, as long as each tree was within 10 m of the centre point; if one or more of the nearest trees were further than 10 m from the centre point, the measurements for those trees were not included (there were no plots with zero trees);
- canopy cover (percent) at 10-20 m, measured using a spherical densitometer at the central point of each plot;
- canopy cover (percent) at 20 m and above, measured using a spherical densitometer at the central point of each plot;
- number of fallen trees, dead or alive (trees with DBH ≥10 cm leaning at an angle greater than 45° to the vertical) within 10 m of the central point;
- number of cut stumps with a diameter ≥10 cm within 10 m of the central point;
- percentage of ground cover occupied by small trees (<5 m in height) within 10 m of the central point, estimated using 6 classes: <1, 1-5, 6-25, 26-50, 51-75 and 76-100.
Data Analysis
Activity Budgets
We applied a number of filters to the data to select only habituated orang-utans with at least 50 h of focal data per individual, excluding follows shorter than 3 h in length and only using data collected by H.C.M.-B. (1,010 h). In total 16 individuals from 4 different age-sex classes were selected: 4 flanged males (258 h), 5 unflanged males (87 h), 4 sexually active females (244 h) and 3 non-sexually active females (421 h).
Activity budgets (feeding, resting, travelling) were calculated as a percentage of the daily active period, i.e. the time from leaving the night nest in the morning until lying down in the nest in the evening. Diet composition is presented as a percentage of feeding time. Results are calculated per individual, and then averaged to provide a mean for each age-sex class. The results for each of the 4 age-sex classes are averaged to present a population mean within each habitat class.
Habitat Preference
Orang-utans' preference for each different habitat class was assessed by calculating Jacob's D value [Jacobs, 1974]: D = (r - p)/(r + p - 2rp), where r = relative frequency of use (number of counts in each habitat class/total number of counts, compiled from behavioural data) and p = proportion of each habitat class in the study area.
These values are bounded between -1 and 1 with 0 being neutral (neither disproportionate selection nor avoidance). Positive values indicate preference and negative values indicate avoidance. Jacob's D values were calculated for the population as a whole, owing to small and uneven sample sizes for each age-sex class if taken on their own.
In the same way, behavioural data were used to calculate Jacob's D values for each primary activity (feeding, resting, travelling) in each habitat class, the frequency of nest construction in each habitat class and the percentage of time feeding on each major food type (fruits, leaves, bark and other) in each habitat class.
Habitat Measurements
In order to test the hypothesis that our habitat classes reflected real and predictable differences in habitat quality, we analysed the measurements in two ways. First, we assigned scores to each measured variable, with high scores reflecting unlogged habitat and low scores reflecting logged habitat, to see if the rank order of classes matched our perceptions. Second, to test whether the habitat classes were significantly different from each other, a multinomial logistic regression was used. The results of the habitat measurements are shown in table 2.
Mean values and standard deviations for the 8 habitat variables measured in each habitat class
The scoring method weighted each measured variable on a scale from 0 to 100. The 5 variables which were considered indicators of good-quality forest, i.e. large and medium-sized tree density, mean tree diameter and canopy cover at 10 m and at 20 m were scored positively by giving a score of 100 to the class with the highest value and assigning scores relative to that to all other classes (such that the score = Xv/X1·100, where Xv is the value to be converted and X1 is the highest value). The variables that were considered indicators of disturbed forest, i.e. number of tree stumps, tree falls and saplings, were scored negatively by assigning a score of 0 to the class with the highest value and assigning scores relative to that for all other classes [such that the score = (1 - X1/Xv)·100].
Scores were combined for each habitat class, and the results are shown in table 3. The habitat class with the highest score represents the best habitat quality with the least disturbance and vice versa. The scoring method used to distinguish between the different habitat types matched with the predicted rank order from visual estimation of habitat quality, i.e. TCA (tall connected A) was the best-quality habitat and S (secondary) was the worst. Therefore, we were confident to use the visual determination of habitat classes as a means for classifying habitat quality.
Relative scores for each habitat class

A multinomial logistic regression confirmed that these habitat classes can be separated, despite high standard deviations for many variables as shown in table 2. The Nagelkerke R2 value (0.804) was high, showing there is a high degree of variance (80%) between the different habitat classes. This classified 61.4% of habitat classes correctly, and an overall significant difference between habitat classes was found (χ2 = 288.727, d.f. = 42, p < 0.001). The significant predictors for differences between the habitat classes are canopy cover above 20 m (χ2 = 33.517, d.f. = 6, p < 0.001), number of tree falls (χ2 = 32.794, d.f. = 6, p < 0.001), number of small trees (χ2 = 39.815, d.f. = 6, p < 0.001), tree size (mean DBH; χ2 = 21.263, d.f. = 6, p = 0.002), density of medium-sized trees (χ2 = 15.403, d.f. = 6, p = 0.017) and density of large trees (χ2 = 14.026, d.f. = 6, p = 0.021). No significant result was found for stump density (p > 0.05) or canopy cover at 10-20 m (p > 0.05).
Thus, the different habitat classes can be clearly distinguished from each other, justifying the use of these 7 classes for visual determination of habitat quality, and their integrity as structurally different classes of habitat quality.
Results
The proportion of each habitat class in the forest is shown in figure 3. The incomplete (selectively logged) habitat classes were most common: TIC (tall incomplete connectivity; 41%) followed by MIC (medium incomplete connectivity; 23%). The secondary (S) and tall complete (TCA) were the rarest habitat types, covering 3.5 and 3% of the forest, respectively.
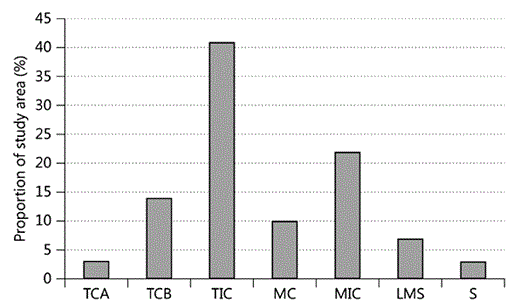
Proportion of each habitat class found in the study site; for abbreviations, see figure 2.
Proportion of each habitat class found in the study site; for abbreviations, see figure 2.
Orang-Utan Habitat Preference
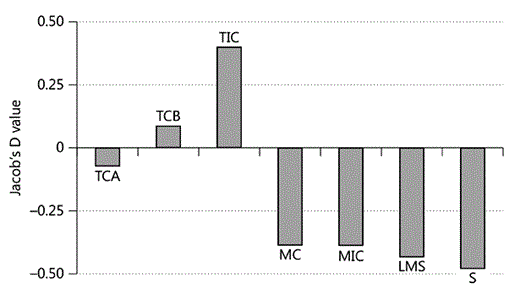
The overall Jacob's D value for preference shows that orang-utans were actively choosing and avoiding certain habitat quality classes (fig. 4). Orang-utans were positively choosing the tall habitat classes (TCA, TCB and TIC) and avoiding the smaller habitat classes (medium connected, MC; MIC; lower mixed secondary, LMS; S), regardless of canopy cover.

Jacob's D value for each habitat class. Positive values indicate preference, i.e. the orang-utans spent more time in this habitat class than if they used the habitat at random. Negative values indicate avoidance. For abbreviations, see figure 2.
Jacob's D value for each habitat class. Positive values indicate preference, i.e. the orang-utans spent more time in this habitat class than if they used the habitat at random. Negative values indicate avoidance. For abbreviations, see figure 2.
Feeding
The Jacob's D values show that orang-utans were preferentially choosing the tall habitat classes TCB and TIC for feeding and actively avoiding the medium height (MC and MIC) and secondary (LMS and S) habitat classes (fig. 5). There was a small negative value for TCA. The degree of canopy completeness appears unimportant.
Jacob's D value for feeding.
Resting and Nest Making
The Jacob's D values show that tall habitats and those with connected canopy were actively preferred for resting (TCA, TCB, TIC, MC), whereas the lower-height incomplete habitats (MIC, LMS and S) were actively avoided for both resting (fig. 6a) and nesting (fig. 6b).
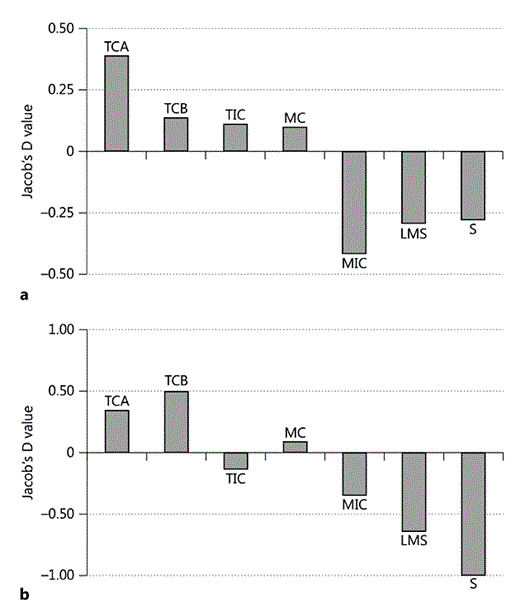
Jacob's D values for resting (a) and nesting (b). Note the graph in b is on a scale of 1 to -1.
Jacob's D values for resting (a) and nesting (b). Note the graph in b is on a scale of 1 to -1.
There was a positive preference for nesting in the habitats with the most connected canopy, regardless of height, as TCA, TCB and MC were selected. The habitats with incomplete-connectivity canopies (TIC, MIC) and the secondary habitats (LMS and S) were selected against (fig. 6b). No nests were built in habitat class S. Thus, canopy completeness seems to be more important than canopy height when choosing nesting sites.
Travelling
It is mostly shown by the Jacob's D values that there is no obvious preference for travelling, apart from some selection against MIC and for TCA, in common with the overall pattern (fig. 7).

Jacob's D value for travel.
Activity Budgets
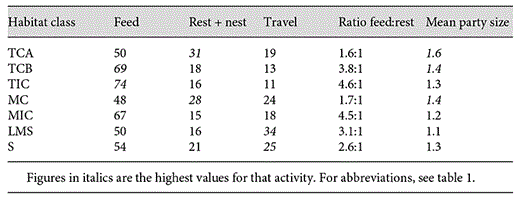
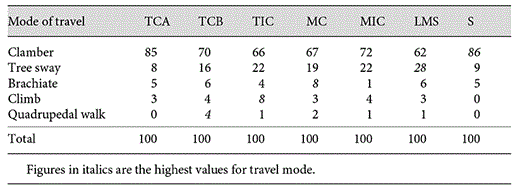
The activity budget of orang-utans differs depending on which habitat class they were in (table 4), with a clear distinction between the complete, incomplete and secondary habitats. The ratio of time spent feeding, compared to time spent resting, was much higher in the most open, non-connective-canopy habitats of TIC and MIC (both approx. 4.5:1) compared to the complete-canopy habitats of TCA and MC (both approx. 1.6:1). The Jacob's D values suggest that this relationship is found because orang-utans prefer to rest (and nest) in complete-canopy habitat, and not because of any preference to feed in incomplete-canopy habitat; instead they appear to prefer tall forest in which to feed. In the secondary habitat classes (LMS and S) neither feeding nor resting is high - and the Jacob's D values for these activities are strongly negative for both secondary classes. Instead, they spend between a quarter and a third of their time travelling, when in secondary habitat, more than in the taller habitat classes. For travel, different modes of locomotion were used in the different habitat classes (table 5), with quadrupedal walking occurring more in the complete habitat classes TCB and MC, whereas climbing was commonest in TIC and tree-swaying more in the low (LMS) and incomplete classes (TIC and MIC; table 5).
Orang-utan activity budget (%), ratio of time feeding compared to resting, and mean party size in each habitat class
Modes of travel (%) in each habitat class
Socialising
The largest party sizes were recorded in the tallest and most complete habitat classes of TCA, TCB and MC (table 4) indicating that orang-utans prefer (or are more able) to socialise in these habitat classes.
Diet
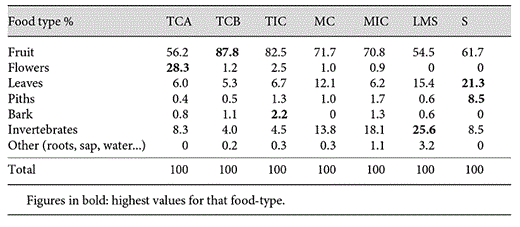
Orang-utan diet in the different habitat classes also differs (table 6). Fruit and flowers together form a much larger part of the diet in the tall habitats (TCA, TCB and TIC) than in the low and secondary (LMS and S) forest classes. Orang-utans have a much larger proportion of leaves, piths and invertebrates in their diet when in the medium, low and secondary habitat classes.
Diet profile (%) in each habitat class
Discussion
Habitat Classes
Out of the 7 habitat classes identified in this study, the TIC and MIC habitat classes were found to be the most dominant, making up 60% of the forest area combined. This is due to past logging in the area which has removed a lot of tall trees and left many gaps in the canopy, in common with other selectively logged forests in Borneo [Ancrenaz et al., 2010]. The standing biomass in the study area decreased by approximately 20% between 1993 and 2003 as a result of continued logging during this period [Husson et al., 2009] and less than 20% of the forest is now in, or close to, the primary state. Cannon and Leighton [1994] found that it took 8 years for severely disturbed areas to recover any canopy structure beyond the short-stature stand, which is formed by pioneer species, and at the time of this study many parts of the study area were in this state, with patches of old-logged, recently logged and unlogged forest creating the observed fine-scale mosaic of habitat classes.
Habitat Quality Preference
All 7 habitat-quality classes were used by orang-utans, but they clearly preferred certain habitat quality classes over others. Overall, there was a positive preference for the taller and, thus, by extension, less logged habitats, over the medium-height and secondary classes which were all avoided.
We suggest that the observed preference for tall forest, regardless of completeness, means that the presence of large trees is more important for orang-utans than a more complete, but smaller-canopy forest, even though there are more intact arboreal pathways in the latter. The preference for the tall habitat classes is presumably because large trees are more likely to fruit and have larger crop sizes. Niche separation between other sympatric primate species may also play a part. Wich et al. [2002] showed that orang-utans fed mainly on the largest fruiting trees and largely ignored the smaller fruit-bearing trees, which were instead fed upon by other species. Thus, it appears that orang-utans deliberately search out habitat patches with large trees. This is supported by party size data, with mean party size highest in the tallest and most complete habitat classes. Orang-utan party sizes are observed to be higher when fruit availability is high [Sugardjito et al., 1987; Utami et al., 1997; Knott, 1999b; Morrogh-Bernard et al., 2009] which leads to increased socialisation and learning opportunities.
When habitat preference was broken down by activity, orang-utans preferred to feed in the tallest habitat classes, regardless of canopy completeness, preferred to nest in the connected-canopy habitat classes, regardless of canopy height, and largely avoided the low-canopy secondary habitat classes. Although some preference and avoidance for certain habitat classes for travelling can be inferred from the data, it is argued that orang-utans would not ‘choose' to travel in any particular habitat, for if they did, they would have to travel through other habitats to get to their preferred habitat, which is paradoxical.
These patterns hold true for all 7 habitat classes, with the lone exception being a small-negative Jacob's D value for feeding in the least-disturbed habitat class TCA, which is contrary to our hypothesis. The area of this habitat class post-logging was very small (3% of total forest area), so it is notable that it was actively sought out for nesting in. Perhaps the reason that no such preference was found for feeding in TCA is because sufficient food resources were present in the more widespread TCB and TIC classes, meaning that energy did not need to be expended in searching for sparse TCA patches. Alternatively, this may simply be an artefact of a small sample size.
Arboreal primates that remain in an area after logging are faced with the loss of food resources, i.e. large fruiting trees. In these cases there are two options available to them: (1) increase search time, hence increasing energetic costs, or (2) reduce selectivity of food items, hence minimising cost at the expense of quality [Marsh et al., 1987]. Both strategies were adopted in a Sumatran forest, where orang-utans became more folivorous and were also found to expend more energy by travelling more and using more energetically expensive locomotion in logged forest [Rao and van Schaik, 1997]. In the Batang Serangan agroforest system in Sumatra, Campbell-Smith et al. [2011] found that orang-utans used a combination of resource monitoring (by increasing daily travel distance to locate agriculture fruits - high-energy foods) and food selection (increased fallback foods in their diet when needed) for survival. In Sabangau, where the remaining good-quality habitat is patchily distributed, orang-utans show preferences for the tall habitat classes, and actively seeking these out presumably increases energetic costs. A change in diet is also apparent, for while orang-utans fed mostly on fruit and flowers in the TCA and TCB habitat classes, invertebrates, leaves and monocot piths were eaten more when in the more disturbed habitat classes. This demonstrates a change to a less selective, more insectivorous and folivorous diet in the disturbed habitat classes, because fruit availability is lower here.
Unlogged sites have a higher proportion of large feeding trees for orang-utans than logged sites [Felton et al., 2003], although stem density is often significantly higher in logged areas. Thus, the heterogeneous structure of logged forest tends to force primates to search more intensively through the remaining patches of vegetation, resulting in more dispersed foraging [Johns, 1986]. This ability to adjust foraging strategies to cope with variations in habitat and food supply probably accounts for the continued survival of many primate populations in logged forest [Johns, 1986]. So the orang-utans' ability to adapt and alter their activity patterns and diet [Knott, 1998, 1999a, b; Morrogh-Bernard et al., 2009] has allowed them to persist in logged habitat, albeit at lower densities [Morrogh-Bernard et al., 2003; Husson et al., 2009].
Travel and type of locomotion were also affected by habitat quality. The proportion of time spent travelling was highest in the secondary habitat classes, and the type of locomotion used changed depending on the habitat class which they were in. Although locomotion costs account for less than one fifth of the total daily activity costs of mammals [Karasov, 1981], large body size and longer daily travel distances increase these costs [Warren and Crompton, 1998]. By preferentially selecting certain habitat classes for feeding and nesting, orang-utans are increasing their daily travel distance as they search for and move between these patches. The incomplete canopy structure means that orang-utans must also expend energy climbing and descending large feeding trees. Climbing was more common in the unconnected habitat classes, as orang-utans often could only enter and leave large feeding trees by ascending and descending the trunk [pers. observation], thus expending more energy than would be needed in a continuous canopy forest [Cant, 1992; Rao and van Schaik, 1997; Thorpe et al.,2007].
With regard to nesting, it has been implied in many studies that orang-utans select open habitat (e.g. slopes and vegetation breaks) for nesting, as this gives them a good look-out for predator detection [Harrisson, 1969; MacKinnon, 1974; Rijksen, 1978]. The conclusion was the same in previous studies of nest site selection in Sabangau. Sabangau does not have slopes, but orang-utans did select nest sites on the edge of clearings, which was again interpreted as beneficial for predator detection [Hearn, 2002; Gibson, 2005]. In contrast to these studies, Sugardjito [1983] suggested that orang-utans do not seem to be alert in their nests and instead rely on camouflage and concealment for protection. Instead, increasing safety by reducing detectability and also exposure to the natural elements is a strong influencing factor in nest site location [Anderson, 1998; Ancrenaz et al.,2004a], and this potentially serves to explain the choice of connected-canopy areas for nesting (and resting) in Sabangau. Habitat classes with connected canopy provide more protection from the elements, more concealment and are also less prone to tree falls, which are more common in logged forest [Ancrenaz et al.,2004a, b], and therefore nesting here is safer and more comfortable.
Implications for Conservation
Orang-utans do show a preference for different habitat classes, with the quality of the habitat affecting their behaviour greatly, from diet and nesting sites to modes of locomotion and, by implication, their energy balance. The patchy distribution of different habitat classes means that orang-utans have to spend more time searching for certain classes in order to find sufficient food and suitable nesting sites. Food availability and, thus, energy balance are major influencing factors on activity budgets and habitat use. Large amounts of ketones are found in orang-utan urine at times of low fruit availability [Knott, 1998; Morrogh-Bernard, 2009], indicating that orang-utans cannot exist on little or no fruit for extended periods of time. Thus, if the small-secondary habitat was the only habitat type available to orang-utans, fruit would be limited and as a result, their diet would have to become more insectivorous and herbivorous, as invertebrates, leaves and piths would dominate. Leaves are less energy-rich compared to flowers and fruit [Knott, 1998, 1999a, 2005; Harrison, 2009], leading us to conclude that it is unlikely that orang-utans would be able to persist for a prolonged period of time in the lowest-quality habitat classes.
Unsurprisingly, fruit availability is highly correlated with orang-utan density [Knop et al., 2004; Wich et al., 2004] and, thus, carrying capacity. Overcrowding can become an issue, with a distinct localisation of activities in areas less affected by logging. The effects of habitat modification on orang-utan behaviour and survival are dependent on the proportion of tall habitat classes (connected and unconnected) remaining in an area. The intensity of logging in a forest where orang-utans, or indeed any large frugivore, are found must be controlled and managed so that the forest does not become dominated by the small-secondary habitat classes as described in this paper. Well-managed, selectively logged areas with a high percentage of tall primary habitat classes remaining can be called ‘relic primary' forests [B. Galdikas, pers. commun.], which are highly likely to hold viable populations of orang-utans.
Therefore, areas where selective logging operations are well managed and do not completely destroy the original forest structure, by retaining a high number of large trees and a degree of continuity in the canopy (i.e. leaving sizeable areas of habitat classes TCA, TCB and TIC), must be kept and conserved. These larger trees will act as important seed trees and aid regeneration of logged areas, as well as providing fruit and shelter for orang-utans. A well-managed selective logging operation will enable orang-utans to persist, preventing a habitat dominated by a small secondary habitat. Thus, as more habitat is gazetted for clearance, and the global population of this endangered ape continues to decline [Singleton et al., 2004], retaining previously logged lowland forests in Indonesia and Malaysia under forestry management is a crucial management strategy for Borneo's remaining rain forest [Chapman et al., 2000; Husson et al., 2009; Ancrenaz et al., 2010]. In Indonesia in particular, previously logged forests are classed as degraded and then fast-tracked for conversion, often to oil palm plantation. Our results, and those of many others, demonstrate that logged forest retains biodiversity and conservation value, and that the animals within find a way to cope with the logging disturbance. We urge a landscape-level approach to spatial planning that designates truly deforested or heavily degraded areas for agriculture and retains as much forest as possible under forestry management. Such options include: designating forests for conservation; establishing REDD (Reducing Emissions from Deforestation and Degradation) projects to prevent further forest degradation and generate income as a result; continuing low-intensity selective logging as suggested by Chapman et al. [2000] under the concession system, or designating restoration forests. Selectively logged areas should be protected from logging for a period of several decades in order to allow the forest to be sufficiently restored to allow a second bout of timber harvesting in the future. All these designations can be income generating or sustainably funded and need not impact on agricultural production and resource extraction whilst retaining the conservation value of a landscape.
Acknowledgements
We would like to thank all our sponsors, Dr. Suwido Limin, Director of the Centre for International Cooperation in Sustainable Management of Tropical Peatlands for supporting our research in the ‘natural laboratory' (Laboratorium Alam Hutan Gambut: Natural Laboratory for the Study of Peat Swamp Forest), and the Indonesian Institute of Sciences LIPI for granting permission to undertake this research. We thank our financial supporters: the Wildlife Conservation Society, US Fish and Wildlife Service Great Apes Conservation Fund, Primate Conservation Inc. and the L.S.B. Leakey Foundation. Special thanks go to all our field assistants: Mark Harrison, Carly Waterman, Nick Merchant, Santi, Twenti, Thomas, Zeri, Ari and Iwan. We would also like to thank Serge Wich, Kim McConkey and 3 anonymous reviewers for their comments on earlier drafts.
