

Abstract
Background: Early diagnosis of vasospasm following subarachnoid hemorrhage can prevent cerebral ischemia and improve neurological outcomes. This study numerically evaluates the relevance of extracranial blood velocity indices to detect vasospasm. Methods: A numerical model of cerebral blood flow was used to evaluate the hemodynamics associated with anterior and posterior vasospasm under normal and impaired cerebral autoregulation conditions. Extracranial blood velocities at the carotid and vertebral arteries and their ratios between ipsilateral and contralateral, anterior and posterior, and downstream and upstream arteries were monitored during vasospasm progression. Results: For current clinical indices that track blood velocities at vasospastic arterial segments using transcranial Doppler (TCD), we observed that velocities increased initially and then decreased with vasospasm progression. This nonmonotonic behavior can lead to false-negative decisions in moderate to severe vasospasm. Alternatively, volumetric flow decreased monotonically at the affected arteries, leading to blood velocities upstream of the vasospastic artery also decreasing monotonically. Based on this principle, we demonstrate that velocity ratios between the carotid and vertebral arteries may better identify moderate to severe vasospasm and improve sensitivity and specificity of vasospasm detection. Conclusion. The velocity indices proposed in this study may enable new or improved noninvasive diagnosis of vasospasm using extracranial Doppler ultrasound. Compared to current clinical indices, the new indices may improve the handling of (1) scenarios of severe vasospasm or impaired cerebral autoregulation, (2) systemic changes in blood pressure and cardiac output, (3) vasospasm occurring in arteries distal to the cerebral circle region, and (4) cases with insufficient acoustic bone window for TCD. The results provide a concrete basis for future clinical evaluation of extracranial indices for vasospasm detection.
Introduction
Cerebral vasospasm is the leading cause of mortality and morbidity next to subarachnoid hemorrhage (SAH) [1,2]. Depending on its definition [3], vasospasm occurs in roughly half of SAH patients, and about half of these patients develop ischemic neurological deficits [4]. Early detection of vasospasm after SAH can help in initiating timely treatment to prevent cerebral ischemia and improve neurological outcomes.
The spontaneous development or abatement of vasospasm following SAH is difficult to diagnose based on neurological symptoms especially in patients with significant neurological impairment at baseline, or those who require sedative medications [5]. Digital subtraction angiography (DSA) is considered the gold standard for diagnosing of large artery vasospasm. DSA provides high spatial resolution and facilitates immediate endovascular treatment if vasospasm is detected [6,7]. However, the technique is invasive, expensive, disruptive to patient care, often requires general anesthesia, and accompanies a small risk of stroke [5].
Among the alternatives to DSA (e.g., SPECT [8,9]), CT angiography (CTA) has the advantage of being an accessible and quick addition to noncontrast CT. CTA has high positive and negative predictive values [5] and when combined with CT perfusion the accuracy is further improved [10]. Disadvantages of the method include increased radiation and the use of iodinated contrast agents. While CT is relatively of a low cost and is easily accessible, it is not routinely used for vasospasm monitoring given the limitations noted.
Transcranial Doppler (TCD) is a well-established noninvasive modality that is available at bedside for vasospasm detection, and can be used on patients under anesthesia or sedation. Blood velocities in basal cerebral arteries are measured and a large increase in the velocity is used to identify vessel narrowing due to vasospasm. Typically, mean velocities higher than 120 cm/s indicate vasospasm [11]. To improve the accuracy of the method, Lindegaard et al. [12] suggested the use of the velocity ratio between anterior or middle cerebral artery (ACA or MCA) and extracranial internal carotid artery (ICA) for ACA or MCA vasospasm diagnosis. Similarly, Soustiel et al. [13] proposed the velocity ratio between the basilar artery (BAS) and extracranial vertebral artery (VERT) for BAS vasospasm. Ratios larger than 3 (Lindegaard) or 2 (Soustiel) indicate anterior or posterior vasospasm, respectively. Even with these augmentations, numerous studies have reported the presence of a weak correlation between TCD and angiographic results [10,14]. False-negative decisions can be made when the vasospasm originates in the distal vessels, or is severe enough that the blood velocity decreases even in the narrowed vessels. Moreover, with systemic changes, such as high blood pressure, blood velocity can increase and lead to the making of false-positive decisions. Therefore, TCD has been used as a preliminary diagnostic tool to prompt the use of more accurate angiographic techniques.
Since TCD measurement is highly examiner dependent and in many cases cannot be used because of insufficient acoustic cranial bone window, we target an alternative to TCD. We focus on the primary consequence of all vasospastic vessels (both proximal and distal), which is the regional reduction and imbalance of cerebral blood flow (CBF). We monitor this imbalance by extracranial blood flows to mitigate the limitations of TCD mentioned above. In this study, we hypothesized that vasospasm can be detected by monitoring blood velocities (or flow rates) at extracranial source arteries (carotid and vertebral arteries) only. This was achieved by comparing the ratios among these flow rates against a baseline (vasospasm-free) condition. We demonstrate that the relative changes of extracranial ratios from the vasospasm-free condition can detect local blood flow reductions due to vasospasm, and distinguish vasospasm from other factors such as systemic changes to blood pressure.
Before proceeding to clinically evaluate the proposed indices, the study here employed an in silico computational investigation using a previously validated arterial blood flow model of the major cerebral arteries that is coupled with a sophisticated lumped parameter (LP) intracranial model [15,16]. The following are the primary benefits of an in silico approach: (1) we can model a wide range of severity of vasospasm at different proximal and distal cerebral arteries; (2) we can simulate impaired cerebral autoregulation (CA), which is a complicating factor in SAH; and (3) we can introduce topological variations of the circle of Willis (CoW). Therefore, we expect that the model-based numerical investigations can help to establish the validity of our approach beyond potentially limited pathophysiological situations that can be encountered in small clinical studies.
Methods
Numerical Model
The brain has unique abilities to maintain adequate CBF under various physiologic conditions. Important features of intracranial hemodynamics include CA, CO2 reactivity, cortical anastomosis and subject-specific topology of communicating arteries. The functions of these are highly coupled, and nonlinearly related to cerebrospinal fluid (CSF) and intracranial pressure (ICP) dynamics. Moreover, blood distribution and pulse wave dynamics in the cerebral arteries can be affected by flow and pressure in the large systemic arteries and veins. We have developed a sophisticated computational model to account for these factors [16], and this model was used to generate a hemodynamic database for vasospasm at various cerebral arteries. Our model has been validated against clinical measurements, including blood flow distribution, pulse waveforms of blood velocity and pressure, the dynamic response of CA during carotid compression, and pulse waveform changes during hyperventilation or CO2 inhalation.
The computational model is comprised of a distributed one-dimensional (1-D) network of the major systemic and cerebral arteries. A diagram of the arterial network used in this study is shown in Figure 1a. The following vessel segments are considered in the model: aorta (#1, 2, 4, 8), brachiocephalic (#3), subclavian (#7, 9), brachial (#15, 16), common carotid (CCA #5, 6), internal carotid (ICA #11, 12, 18, 21, 38, 39), external carotid (ECA #10, 13), vertebral (VERT #14, 17, 44, 45), basilar (BAS #22, 34, 35), posterior communicating (Pcomm #19, 20), anterior communicating (Acomm #31), middle cerebral (M1 #23, 24), anterior cerebral (A1 #25, 26; A2 #29, 30), posterior cerebral (P1 #27, 28; P2 #32, 33), superiorcerebellar (#40), anterior and posterior inferior cerebellar (#41, 42, 43), and ophthalmic arteries (#36, 37). An “R” and “L” in front of the vessel abbreviations are used to denote the right and left side of the body, respectively. Blood flow and pressure in each vascular segment are computed by solving the cross-sectionally averaged Navier-Stokes equations using a finite volume method.

a Schematic of the 1-D arterial network. Outflow boundaries marked with “o” are coupled with the LP network in (b), and boundaries marked with “·” are coupled to 3-element Windkessel models. Locations where vasospasm is tested are marked with “x”. b Schematic of the LP network model. The bounding box represents intracranial space, and a single ICP model is shared by the 6 cerebral distal vascular bed models inside the intracranial space.
a Schematic of the 1-D arterial network. Outflow boundaries marked with “o” are coupled with the LP network in (b), and boundaries marked with “·” are coupled to 3-element Windkessel models. Locations where vasospasm is tested are marked with “x”. b Schematic of the LP network model. The bounding box represents intracranial space, and a single ICP model is shared by the 6 cerebral distal vascular bed models inside the intracranial space.
Terminal segments of the distributed 1-D model are coupled to LP models that represent the respective downstream vascular bed. LP models of the intracranial circulation (coupled at locations marked with an “o” symbol in Figure 1) represent distal vascular territories downstream of the anterior, middle, and posterior cerebral arteries. A schematic of the LP network for the intracranial space is shown in Figure 1b. Distal vascular models are coupled with an ICP model. The elements in the LP network represent the pial/small arteries, arterioles, capillaries, and venous beds. The formation and reabsorption of the CSF are driven by dynamic changes in the capillaries and the ICP. The venous bed is collapsible and modeled as a starling resistor. The model also includes distal collateral pathways important in rerouting CBF. The conductances of the elements shown are governed by differential and algebraic equations that model known mechanisms for autoregulation and CO2 reactivity. The reference geometries (length and diameter when transmural pressure is zero) and mechanical properties of the vessels are adopted from physiological data in [17,18,19,20] and parameters for the LP models were adopted from [21]. Impaired CA was simulated by disabling active autoregulation gains in the model. Complete parameters for the baseline model, as well as impaired CA, can be found in [16] along with detailed descriptions of the mathematical models and numerical procedures.
This cerebrovascular model was used to virtually generate CBF conditions due to progressive vasospasm. Anterior (MCA and/or ACA) and posterior (posterior cerebral and/or basilar) circulation vasospasm was considered under normal and impaired CA conditions. The topology of the CoW was varied to examine the role of relevant communicating arteries.
Strategy to Diagnose Vasospasm Using Extracranial Velocity Ratios
Arteries of the cerebral circulation can be categorized by generations and primary blood pathways (Table 1). This can be further detailed as the number of measured arterial segments increases. The generations are denoted as S-1, S-2, and S-3 for source arteries, and C-1, C-2, and C-distal for cerebral arteries. Arteries in the same generation (same column) have comparable blood flow rates and are affected by systemic changes in a similar manner. However, vasospasm and other local pathological conditions in brain (e.g., stenosis) can reduce blood flow in localized pathways, and affect the ratio of flow rates or velocities among the same generation of arteries. In this study, we focus on the changes in the following ratios during the progression of vasospasm (less important ratios are within parenthesis):

• Right/left (R/L) ratios: VRICA/VLICA, (VRCCA/VLCCA, VRVERT/VLVERT),
• Anterior/posterior (A/P) ratios: VRICA/VRVERT, VLICA/VLVERT, (VRCCA/VRVERT, VLCCA/VLVERT),
• Downstream/upstream (D/U) ratio: (VRICA/VRCCA, VLICA/VLCCA).
Similar ratios in the cerebral arteries can be monitored by TCD as well (e.g., VRA1/VLA1, VRA1/VRP1). However, the use of TCD introduces additional errors and limitations discussed above.
Measurements from an initial vasospasm-free condition are required and can be obtained when patients are admitted to the neuro-ICU. Typically, vasospasm does not occur before 2 (traumatic SAH) or 3 (aneurysmal SAH) days after the hemorrhage. If vessel diameter can also be measured using color-duplex ultrasound, volumetric flow rate ratios can alternatively be monitored; however, here we focus on the more easily obtained velocity ratios.
Results
In section 3.1, we consider the specific case of an MCA vasospasm to demonstrate some deficiencies of the current intracranial indices, and the feasibility of the newly proposed extracranial indices for evaluating (severe) vasospasm. In section 3.2, we generalize this approach to other vasospasm conditions.
MCA Vasospasm
Figure 2 considers a progressive vasospasm of the RM1 segment of the right MCA. TCD diagnosis is typically based on absolute velocity (VRM1) and the Lindegaard index (VRM1/VRICA). These indices are plotted in this figure for healthy and impaired CA conditions for progressive vasoconstriction of the RM1 segment. As vasospasm progresses, VRM1 increases up to 220 cm/s (normal CA) or 130 cm/s (impaired CA). The impaired case barely reaches the typical vasospasm condition of TCD diagnosis (120 cm/s). These simulation results demonstrate a similar trend in blood velocity changes due to progressive vasospasm as documented in previously published measurements [22]. However, as the vessel is constricted further, velocity decreases rapidly (shaded region) due to the increased resistance at the vasospastic segment leading to overall redirection of blood flow to alternative proximal pathways. This reduction of the blood velocity can be misinterpreted as a sign of recovery, and hence a false negative diagnosis. That is, it would become ambiguous if a trending of lower velocities indicated a recovery or an exacerbation. The Lindegaard index also demonstrates a similar non-monotonic trend, reaching 6 and 4 for healthy and impaired CA conditions respectively (>3 is typically assumed to be a vasospasm condition). These figures illustrate the inherent difficulties of detecting vasospasm using TCD, even with synthetic velocity data not subject to measurement error or confounding physiologic effects. Only over a specific range of conditions can vasospasm be detected with the velocity and Lindegaard index, and the ability to detect vasospasm degrades with impaired CA condition, which often occurs in SAH patients [23].
![Fig. 2. VRM1 (a) and the Lindegaard index (VRM1/VRICA) (b) during vasospasm at RM1. Healthy (solid lines) and impaired (dashed lines) CA conditions are compared. Symbols are from experimental measurements by [22]. Vertical bars correspond to 30 and 50% reduction of RM1, which estimates the degree of vasospasm. The region over which vasospasm is diagnosed by TCD (120 cm/s or 3) is marked with horizontal lines.](https://karger.silverchair-cdn.com/karger/content_public/journal/ced/43/5-6/10.1159_000454992/2/m_000454992_f02.jpeg?Expires=1717075804&Signature=pIc~o2VexFHBcnOE-5PHzIDGl2Afvrn4ZF67QePmZxoXrMj5tiNRVO8BqQE8VI8uPNMu938VSzEPKEnsbc5ttsbPMpDFrXDnwol0S2ISG5FyfI8cPLXkjlqgabLxuma9SBFjYcoj213fyvHdxQOAmPpozTtcyIdbFyGzw4z6En11r7RM-nVltz23ZSDseENOKImX7tA-oJeOujfuqZsn1Lck1I7tH5jiJdRoy-VCZdQ6pir9qydlpB97BmLTNsSbQY7s77V0ffoR~kQ14q4XT8PrQdRHNl3aS4Iu5sICRBkPvr7cdQL4IMQZj32VEiOnC1AjMkVaMdvNFfRhPZ4yqg__&Key-Pair-Id=APKAIE5G5CRDK6RD3PGA)
VRM1 (a) and the Lindegaard index (VRM1/VRICA) (b) during vasospasm at RM1. Healthy (solid lines) and impaired (dashed lines) CA conditions are compared. Symbols are from experimental measurements by [22]. Vertical bars correspond to 30 and 50% reduction of RM1, which estimates the degree of vasospasm. The region over which vasospasm is diagnosed by TCD (120 cm/s or 3) is marked with horizontal lines.
VRM1 (a) and the Lindegaard index (VRM1/VRICA) (b) during vasospasm at RM1. Healthy (solid lines) and impaired (dashed lines) CA conditions are compared. Symbols are from experimental measurements by [22]. Vertical bars correspond to 30 and 50% reduction of RM1, which estimates the degree of vasospasm. The region over which vasospasm is diagnosed by TCD (120 cm/s or 3) is marked with horizontal lines.
As the vasospasm progresses, more than a 30% blood flow reduction through the RM1 is observed following a 50% RM1 radius reduction with the impaired CA condition (Fig. 3a). For the same case, only around a 10% reduction is observed for the healthy CA condition. As the vessel area is reduced further, blood flow decreases rapidly to zero. This is when the blood velocity and Lindegaard index also decrease in Figure 2. Blood flow rate at the RICA, which is the primary source artery of RM1 (Table 1), is reduced up to ≈30%. Other blood pathways are also affected by the vasospasm through communicating arteries and cortical anastomosis, but the influences are small even with a complete CoW. Thus, local blood flow rate reduction can be detected by comparing blood velocities (or flow rates) among source arteries. For the RM1 vasospasm, VRICA/VLICA and VRICA/VRVERT show ≈30% reduction from vasospasm-free conditions (Fig. 3c, d). The reduction of these 2 ratios can be used to indicate an RICA pathway vasospasm. Moreover, these ratios are more sensitive to vasospasm with the impaired CA condition, whereas current intracranial indices become less sensitive with impaired CA as was shown in Figure 2.

Flow rates at RM1 (a) and RICA (b), and velocity ratios VRICA/VLICA (c) and VRICA/VRVERT (d) during vasospasm at RM1. See Figure 2 for description of vertical bars.
Flow rates at RM1 (a) and RICA (b), and velocity ratios VRICA/VLICA (c) and VRICA/VRVERT (d) during vasospasm at RM1. See Figure 2 for description of vertical bars.
Diagnosis of Vasospasm Using Extracranial Doppler Velocity Measurements
We have generated a hemodynamic database for 30 vasospasm cases (8 anterior and 7 posterior, each with healthy and impaired CA conditions). Blood velocities in all considered arteries are saved during the progression of the vasospasm (i.e., from healthy condition to 99% area reduction in the affected vessel for 800 cardiac cycles). Table 2 lists R/L, A/P, and D/U extracranial velocity ratios for cases with healthy and impaired CA conditions. Vasospasm-free reference values for complete CoW are listed on the top row. Note that these values are slightly different if the CoW topology is varied. For each vasospasm, percent differences from vasospasm-free condition are listed. The values with large changes are highlighted with bold fonts.
Percent change in blood velocity ratios from baseline values for various anterior and posterior circulation vasospasm locations

For right-side anterior vasospasm, R/L ratios (VRCCA/VLCCA and VRICA/VLICA) and right-side A/P ratio (VRICA/VRVERT) show a great decrease in their values. In particular, when both RM1 and RA1 are affected, the decrease is of a greater value. Overall trends are similarly observed in both healthy and impaired CA conditions. When RM1 has vasospasm, the impaired CA case demonstrates larger variations than the healthy case when vasospastic velocity reaches the maximum (first value). This is due to large flow rate reduction with impaired CA during RM1 vasospasm. RA1 and RA2 vasospasm are less affected by CA, since the respective downstream region is well connected by collateral pathways (relatively low resistance anterior-anterior cortical anastomosis). For the same reason, VLICA/VLVERT shows an increase when RA1 or RA2 is affected. When only RM1 is affected, blood flow rerouting toward the left anterior pathway is more dominant than blood flow through cortical anastomosis, and thus VLICA/VLVERT is decreased slightly.
With all posterior vasospasm considered, A/P ratios (VRICA/VRVERT and VLICA/VLVERT) increase from vasospasm-free values due to flow rate reduction in the VERT. If RP1 and/or RP2 are affected, VRICA/VRVERT increases more than VLICA/VLVERT due to a relative increase in RICA flow to compensate for lack of blood flow by rerouting through the RPcomm and/or middle to posterior cortical anastomosis. This causes positive changes for R/L ratios as well. However, if the BAS is affected, R/L ratio is not affected, which may distinguish BAS vasospasm from other posterior vasospasm.
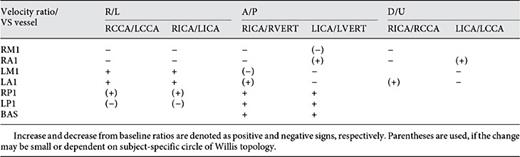
As a diagnosis reference, Table 3 summarizes the changes of extracranial velocity ratios during various arterial distributions of the vasospasm. This is consistent with the changes in flow rate ratios. Increase and decrease from vasospasm-free ratios are denoted as positive and negative signs respectively. If the change was observed to be small or highly dependent on subject-specific conditions, parentheses are used.
Discussion
Clinical evaluation for cerebral vasospasm is often based on intracranial blood velocity measurements using TCD. We have introduced a novel approach of detecting vasospasm that uses the ratios of extracranial blood velocities among the carotid and vertebral arteries. Results from our numerical studies indicated that moderate to severe anterior circulation vasospasm may be effectively detected by monitoring VRICA/VLICA and A/P ratios, and moderate to severe posterior circulation vasospasm may be effectively monitored by A/P ratios. If large changes (>10%) are observed in these ratios, other ratios in Table 3 may confirm the pathway undergoing vasospasm. The approach has clear physiological and mathematical underpinning and is simple in terms of measurement technique and computational requirement.
One important feature of our proposed approach is that it is capable of diagnosing vasospasm in arteries distal to those that can be imaged with TCD, or vasospasm occurring in multiple pathways. Current TCD-based indices apply when the exact arterial segment undergoing vasospasm can be imaged, since these indices rely on detecting the local increase in flow velocity at the vasospastic segment. However, our proposed approach relies on the regional reduction of blood flow, and therefore is indifferent to the exact location of vasospasm. This is important since the arteries accessible to TCD represent a small fraction of the cerebral arteries that may undergo vasospasm. In addition, our proposed approach is most relevant to severe vasospasm, where traditional TCD-based indices fail to properly diagnose. Thus, the proposed extracranial indices can supplement current indices to improve the specificity of vasospasm detection.
SAH patients can show global CBF reduction during 3 weeks after the initial hemorrhage. Schöning et al. [24] observed that CBF was consistently reduced for 3 weeks after hemorrhage, but vasospasm did not seem to affect CBF. This may have been because they defined vasospasm by the high blood velocity conditions in TCD measurements, and as we have discussed, only a certain range of vasospasm scenarios can be detected by this criterion (both in the degree, and location, of vasoconstriction). Moreover, small changes in global CBF during moderate vasospasm are hard to detect. In fact, Schebesch [et al. 25] considered severe vasospasm that caused infarction or neurological deficits, and demonstrated a clear reduction in CBF due to vasospasm. On the other hand, vasopressors and other medical treatments can increase global CBF and blood velocities. The extracranial indices proposed in this study are expected to be less sensitive to these factors when compared to current TCD-based indices, since the L/R and A/P ratios employed become insensitive to global changes in CBF.
Because only extracranial Doppler (ECD) measurements of blood velocities at carotid and vertebral arteries are needed, our proposed approach is applicable at bedside and does not require an acoustic bone window, which does not exist in 5% [26] to 20% [27] of patients. Furthermore, extracranial blood velocities and flow rates can be measured with lower examiner-dependence and intra-subject variability than TCD. Sato et al. [28] reported approximately 5% error in reproducibility of ICA, ECA, and VA blood flow measurements. ECD requires less examiner-training and overall measurement time is shorter than TCD.
There are several limitations in the proposed approach. First, this method can only locate the blood pathway that is affected by vasospasm, and cannot specify the affected arterial segment. However, such information can be obtained from angiography, which is commonly used to confirm a positive bedside diagnosis. Second, although ECD measurement is more robust than that of TCD, it may still be challenging to detect smaller than around 10% changes from vasospasm-free conditions using current ultrasound technology. Table 2 shows that there exist ratios that undergo larger than 10% change for all vasospasms considered; thus, this method is expected to be able to detect most (moderate to severe) basal artery vasospasm. Since TCD can be more responsive to moderate vasospasm, ECD and TCD monitoring may complement each other to strengthen positive and negative prediction and diagnostic accuracy. Finally, this study is based purely on data from numerical simulations. Although this cerebrovascular model has been validated in other regards, and overall results are consistent with expected physiology, clinical studies are necessary to confirm the results and utility of the proposed approach in practice. The results of this study aim to provide an underlying basis for future clinical evaluation of extracranial indices for vasospasm detection.
As a final remark, it is noted that various cerebrovascular diseases affect local CBF changes, which may be detectable by the procedures proposed in this study. Several studies have measured total CBF and attempted to correlate CBF to pathological conditions such as stenosis and vascular dementia (VD) or Alzheimers dementia (AD). Doepp et al. [29] found that CBF decreased among VD and AD patients, while VD patients show obviously more decreased CBF. Extracranial ratios may respond to these conditions better than the total CBF. Considering the low cost and availability of Doppler ultrasonography, routine monitoring of extracranial velocity ratios as proposed here may prove useful in evaluating a wider range of cerebrovascular complications.
Disclosure Statement
The authors declare that the research was conducted in the absence of any commercial or financial relationships that could be construed as a potential conflict of interest.
Funding
This work was supported in part by the Hellman Foundation, the Bakar Faculty Fellows program, National Institutes of Health (award NS076738), and the UCSF Institute of Computational Health Sciences.
