

Abstract
The apolipoprotein E-deficient (apoE-/-) mouse model has advanced our understanding of cardiovascular disease mechanisms and experimental therapeutics. This spontaneous model recapitulates aspects of human atherosclerosis, and allows for the development of dissecting abdominal aortic aneurysms (AAAs) when combined with angiotensin II. We characterized apoE-/- rats and hypothesized that, similar to mice, they would develop dissecting AAAs. We created rats with a 16-bp deletion of the apoE gene using transcription activator-like effector nucleases. We imaged the suprarenal aorta for 28 days after implantation of miniosmotic pumps that infuse angiotensin II (AngII, 200 ng/kg/min). Blood pressure (BP), serum lipids and lipoproteins, and histology were also analyzed. These rats did not develop pathological aortic dissection, but we did observe a decrease in circumferential cyclic strain, a rise in BP, and microstructural changes in the aortic medial layer. We also measured increased serum lipids with and without administration of a high-fat diet, but did not detect atherosclerotic plaques. Chronic infusion of AngII did not lead to the formation of dissecting AAAs or atherosclerosis in the rats used in this study. While reduced amounts of atherosclerosis may explain this resistance to dissecting aneurysms, further investigation is needed to fully characterize species-specific differences.
Introduction
An abdominal aortic aneurysm (AAA) is a potentially life-threatening disease that accounts for approximately 11,000 deaths in the USA each year [1,2,3]. Aneurysms are caused by an initial insult to the aortic wall, leading to inflammatory cell infiltration, extracellular matrix remodeling, and vessel dilation [4]. Aortic dilation of 50% above normal diameter is considered aneurysmal, and the only option for treatment is surgical intervention by either open or endovascular repair [4]. Risk factors for AAAs include male gender, advanced age, smoking, hypertension, heritable predisposition, and atherosclerosis [1]. Noninvasive ultrasound is often used to detect and monitor aneurysm development [4,5,6]. Larger aneurysms have an increased risk of rupture, with 5-5.5 cm considered the typical threshold range for surgical intervention, with slight variation depending on sex, country of treatment, and possible aneurysm shape. The rupture of an AAA is associated with 90% mortality and, in many cases, is the first and only clinical symptom of aortic expansion [4,7]. The fact that no medical therapies exist to limit aneurysm expansion indicates the need to better understand AAA pathophysiology.
Small animal models are often used to study AAAs as they mimic many aspects of the human disease [1,8]. Angiotensin II (AngII)-induced AAAs in apolipoprotein E-deficient (apoE-/-) mice is one of the most common animal models used in the field [8]. The apoE gene is responsible for producing apolipoprotein E, a protein that combines with lipids in the body to form lipoproteins. The lipoproteins compartmentalize and transport cholesterol and fats through the bloodstream. Without the apoE gene (and protein), animals have higher circulating levels of cholesterol and eventually develop atherosclerosis [9]. When infused with AngII, apoE-/- mice become hypertensive, and males are most likely to develop suprarenal dissecting AAAs with an incidence rate of roughly 60% [8,10]. While this mouse model has been used extensively due to the availability of apoE-/- and LDLR-/- transgenic mice [8,11,12,13,14], the combined effect of genetically induced hypercholesterolemia and chemically induced hypertension has not been explored in rats or other species. There are a number of advantages that a rat model can provide over mice when studying aortic aneurysms. For example, rats are physiologically, genetically, and morphologically closer to humans than mice [15,16,17]. The use of a larger rat model could also help develop biomedical devices and novel imaging techniques that are not possible in a smaller animal. For these reasons, we developed and characterized transgenic apoE-/- rats using transcription activator-like effector nucleases (TALENs).
The purpose of our study was to characterize the vascular pathology of apoE-/- rats with a specific focus on AAA development. We hypothesized that these rats would have increased serum cholesterol levels and, when implanted with AngII-filled osmotic pumps, would become hypertensive and develop suprarenal dissecting AAAs.
Methods
Creation of apoE-/- Rats
We generated apoE-/- rats using TALENs (Transposagen, Lexington, KY, USA) targeted to exon 4 of the rat apoE gene (third coding exon) located on chromosome 1. The nuclease recognition sequences used are as follows (with the cut regions underlined):
5′-TGGGAGCTTCCAACTTTAAGAGCGAGCTTCGATTCGTCAGGAAGATGCTGTCA-3′;
5′-TGTACAAGGCCGGGGCACAGGAGGGCGCCGAGCGCGGTGTGAGTGCTA-3′.
Two pairs of circular DNA (10 ng/μL total DNA in 10 mM Tris-HCl, 0.1 mM EDTA) containing TALENs were microinjected simultaneously into the pronucleus of Hsd:Sprague Dawley rat fertilized eggs. We detected this mutation using a CEL1 mutation detection assay, which amplified heteroduplexed DNA (Integrated DNA Technologies, Coralville, IA, USA) using the following primers:
5′-CCC TCT TGT GTT TCC TCT GG-3′
5′-TAT CTG CTG GGT CTG CTC CT-3′.
The samples positive from the CEL1 assay were cloned with Taq polymerase and topoisomerase-charged vectors (TOPO TA cloning kit for sequencing, Invitrogen, Carlsbad, CA, USA), and then sequenced to confirm a 16-bp deletion in heterozygotes (online suppl. Fig. S1; for all online suppl. material, see www. karger.com/doi/10.1159/000484086).
We bred the founder male rat with a wild-type female and genotyped the tail clips from F2 progeny in order to identify animals homozygous for a 16-bp deletion (AGGGCGCCGAGCGCGG; NCBI RefSeq accession No.: NM_001270681.1). This sequence partially codes for a 22-amino-acid approximate tandem repeat. When deleted, a frameshift mutation resulted (p.Glu178fs) upstream of a possible heparin-binding region according to sequence similarity with the human gene (UniProt accession Nos.: P02650 and P02649) [18]. Immediately following the glutamate substitution, the protein is truncated by 134 amino acids.
To genotype the rats, we used PCR for DNA amplification (2.5-h reaction cycle; 64.5-94°C) and purified the products (UltraClean PCR clean-up kit, MO BIO Laboratories, Carlsbad, CA, USA). We then used restriction enzyme digestion with NarI (New England BioLabs, Ipswich, MA, USA), a restriction endonuclease which cuts after the second nucleotide of the sequence GGCGCC, generating cleavage products with 423- and 157-bp bands in homozygotes compared to bands of 352, 87, and 157 bp in wild-type rats (online suppl. Fig. S2).
We compared ApoE expression between wild-type and apoE-/- rats using harvested lung and spleen tissues (see online suppl. Fig. S3). ApoE is abundantly produced in these tissues (among others) [19]. After euthanasia, 50-mg tissue samples were flash-frozen with liquid nitrogen and stored at -80°C. Tissues were thawed on ice and resuspended in 800 μL lysis buffer (150 mM NaCl, 50 mM Tris-HCl, pH 7.6, 1% Triton X-100, 0.1% SDS) supplemented with a protease inhibitor cocktail (Roche, Indianapolis, IN, USA) and 1.5 mM PMSF (Thermo Fisher Scientific, Waltham, MA, USA). Soluble proteins were isolated by mechanical homogenization, incubation with mild agitation for 2 h at 4°C, and centrifugation at 14,000 g for 5 min. Samples for SDS-PAGE and Western blot analysis were prepared by the addition of 4× Laemmli sample buffer with a final concentration of 1% 2-mercaptoethanol (Sigma, St. Louis, MO, USA) and heated at 95°C for 10 min. Protein concentration was measured with the Pierce 660 nm protein assay with ionic detergent compatibility reagent (Thermo Fisher Scientific), and adjusted with 1× sample buffer to 2 mg/mL. A total of 60-80 µg total protein was loaded per lane and separated on a Mini-PROTEAN® TGX gradient (4-20%) gel (BioRad, Hercules, CA, USA), followed by transfer to a PVDF membrane (BioRad). The membrane was blocked in Pierce protein-free blocking buffer (Thermo Fisher Scientific), then probed with an ApoE rabbit polyclonal antibody (ab20874, Abcam, Cambridge, MA, USA; Antibody Registry ID AB_449883) diluted 1:1,000 in 1:1 blocking buffer:Tris-buffered saline (TBS) with 0.05% Tween-20 (TBST) for approximately 3 h at room temperature. The membrane was washed extensively in TBST, then probed with a polyclonal Cy5-conjugated goat anti-rabbit IgG (ab6564, Abcam; Antibody Registry ID AB_955061) diluted 1:10,000 in 1:1 blocking buffer:TBST for approximately 2 h at room temperature. The membrane was washed in TBST, then TBS, and the fluorescence was visualized using the Azure c400 (Azure Biosystems, Dublin, CA, USA) (628/676, ex/em). To assure equal total protein loading, the membrane was stained with Ponceau red (Azure Biosystems) and imaged on an Epson V850Pro scanner. Precision Plus Protein Kaleidoscope prestained protein standards (BioRad) were used to estimate the sizes of the protein bands.
Animal Cohorts
The Purdue University Animal Care and Use Committee approved all animal experiments. Veterinary technicians maintained the rat cages and performed daily animal inspections. We used 2 cohorts of apoE-/- rats from our laboratory (Cohorts 1 and 3) and 1 cohort of commercially available apoE-/- Sprague-Dawley rats (Cohort 2) from Horizon Discovery (St. Louis, MO, USA). Horizon Discovery provided apoE-/- rats (TGRA3710; SD-ApoEtm1sage) with a 16-bp deletion (within exon 3 on chromosome 1) with a confirmed loss of the ApoE protein [20]. All rats underwent surgery to implant miniosmotic pumps filled with AngII (see below). We monitored the animals' appearance and well-being at 1, 24, and 48 h after surgery and provided postoperative care as necessary. Analgesics were not administered due to the minimally invasive nature of the surgery. We followed each cohort for at least 28 days, i.e., corresponding to the amount of time the miniosmotic pumps elute AngII.
All rats were singly housed in contact bedding cages and fed a normal chow diet (Harlan Rodent Diet 2018, Indianapolis, IN, USA) ad libitum. At the time of pump implantation surgery, animals in Cohort 1 (n = 10; 8 males and 2 females) were 9 weeks old. Animals from Horizon Discovery were used for comparison (n = 9 males) and were 9 weeks old at the time of surgery (Cohort 2). Rats in Cohort 3 (n = 3 males) were implanted with pumps after reaching an older age (30 weeks).
Animals in Cohort 1a (n = 5) are a subset of Cohort 1 and were sacrificed at 13 weeks of age. Rats in Cohort 1b represent a subset of Cohort 1 that was not sacrificed after the first study. These animals (n = 5; 4 males and 1 female) were chosen randomly from the rats in Cohort 1. They were aged to 24 weeks, at which point they were placed on an atherogenic diet containing 21.2% fat and 1.3% total cholesterol by weight (Harlan Rodent Diet TD.02028) ad libitum for the remainder of the study. At 30 weeks of age (the same age as animals in Cohort 3), these rats (n = 4; 3 males and 1 female) had been consuming the new diet for 6 weeks. We then performed a second AngII pump implantation and followed these animals for 4 weeks before sacrifice (n = 3; 2 males and 1 female).
We followed the Horizon Discovery rats (Cohort 2) as 2 groups. Animals in Cohort 2a (n = 3) were followed for 4 weeks and sacrificed at 13 weeks of age (the same end point as Cohort 1a). Rats in Cohort 2b (n = 6) are a second subset that we began following at the same age as Cohort 2a but these animals were exposed to AngII for a prolonged period of time (8 weeks). We implanted a second pump in each rat at 13 weeks of age and sacrificed them at 18 weeks of age. Figure 1 details the timeline for the pump implantation surgeries, BP measurements, high-fat diet (HFD) administration, blood collection, and sacrifice end points.

Schematic of study cohorts. Age and number of animals, time of pump implantation, periods for AngII infusion and blood pressure (BP) measurements, time points for blood collection, and start of high-fat diet (HFD) administration are indicated for each cohort. Animal sacrifices were carried out at the point where the line ends along each row. Two animals died unexpectedly after the start of the HFD (Cohort 1b) and 1 died after 6 weeks of continuous AngII infusion (Cohort 2b).
Schematic of study cohorts. Age and number of animals, time of pump implantation, periods for AngII infusion and blood pressure (BP) measurements, time points for blood collection, and start of high-fat diet (HFD) administration are indicated for each cohort. Animal sacrifices were carried out at the point where the line ends along each row. Two animals died unexpectedly after the start of the HFD (Cohort 1b) and 1 died after 6 weeks of continuous AngII infusion (Cohort 2b).
Osmotic Pump Implantation
We implanted an AngII miniosmotic pump (ALZET Model 2004; DURECT Corp., Cupertino, CA, USA) subcutaneously in the left dorsum of each rat. AngII powder (molecular weight: 1046.19; Bachem, Torrance, CA, USA) was first solubilized in sterile 0.9% saline and loaded into the pumps according to animal weight (200 ng/kg/min infusion rate [21] for 28-day duration). To prime the pumps, we incubated them in sterile saline at 37°C overnight before implantation. We performed the same procedure to implant a second pump in the rats in Cohorts 1b and 2b. The first expired pump remained in the rat and the new pump was placed on the opposite side of the animal. No apoE-/- rats were implanted with saline-filled pumps to serve as a control.
Cholesterol Analysis and en face Aortic Staining
A blood serum cholesterol assay (Bioassay Kit Metabolism, Fisher Scientific Co.) was used to analyze total cholesterol in Cohorts 1b, 2, and 3. Tail-vein blood (>60 μL) was collected approximately 1 week prior to pump implantation. Additionally, once Cohort 1b had begun consuming a HFD, blood samples were taken 2, 5, and 6 weeks after the start of the new diet. Samples were centrifuged (7,800 g for 5 min) to collect serum, which was stored at 4°C until analysis. A full lipid panel consisting of cholesterol, triglycerides, high-density lipoproteins (HDL), and low-density lipoproteins (LDL) was also conducted (IDEXX Bioresearch, North Grafton, MA, USA) on serum samples from wild-type (n = 3; 93.7 ± 7.4 days of age) and apoE-/- (n = 3; 40 ± 0 days of age) rats.
Furthermore, we examined the intimal surface of rat aortas ex vivo for the presence of lipid-rich plaques. We removed the periadventitial fat and connective tissue from aortas and cut them longitudinally to expose the inner luminal surface. We acquired high-magnification images of the aortic tree before and after staining with 0.5% Sudan IV solution (Sigma).
Blood Pressure
We noninvasively measured the BP of conscious rats using a tail-cuff system [22] specifically designed for small animals (2 Channel CODA System, Kent Scientific Corp., Torrington, CT, USA). Systolic, diastolic, and mean arterial BP (SBP, DBP, and MABP) were recorded 1 week before pump implantation, 3 days after implantation, and once a week during the 28-day study period. At each time point, we acquired between 40 and 60 runs using an occlusion pressure of 250 mm Hg and a deflation time of 15-20 s.
Small-Animal Ultrasound
We performed in vivo ultrasonography (US) of all apoE-/- rats with a high-resolution, small-animal US system (Vevo2100 Imaging System; FUJIFILM VisualSonics, Toronto, ON, Canada). We acquired transaxial and longitudinal US images prior to surgery (day 0) and at days 3, 7, 14, 21, and 28 after surgery, using a 256-element, linear array transducer (MS250D, 13-24 MHz, 21 MHz center frequency). For Cohort 2b, we also acquired US data on day 56 (or 28 days after the second pump implantation).
The rats were initially anesthetized with isoflurane (2-4% in 1 L/min medical grade air) and then kept unconscious during imaging with isoflurane at 1-2.5%. Prior to imaging, they were positioned supine on an adjustable heated stage, sterile eye lubricant was then applied to each eye, and the hair on the ventral abdominal region was removed with depilatory cream. We noninvasively monitored heart and respiration rate through stage electrodes, and body temperature using a rectal probe. The animals were kept at approximately 37°C throughout the imaging procedure. The transducer was positioned perpendicular to the animal and held stable with a rail mount system. US gel (Aquasonic 100; Parker Laboratories; Fairfield, NJ, USA) was applied to create an acoustic impedance-matching layer between the transducer and the animal's skin. We adjusted the angle of the stage as necessary to optimize visualization of the aorta in the long and short axis. We identified anatomical landmarks (such as the inferior vena cava, renal veins, and aortic bifurcation) for orientation, and observed the presence of pulsatile vessel motion to help distinguish arteries from veins.
During each session of imaging, high-resolution 2-dimensional images were acquired of the suprarenal abdominal aortic region of each rat using brightness mode (B-mode; 300 frames), motion mode (M-mode; 5-s acquisitions), and pulsed-wave and color Doppler (5-s acquisitions). We adjusted the transducer beam angle and pulsed-wave Doppler angle (30-60 degrees from vertical) in order to accurately detect the velocity and direction of blood flow.
We used VisualSonics VevoLab software to analyze the imaging datasets. B-mode data acquired in the long-axis was analyzed to determine mean aortic diameter. We traced aortic specular reflections, representing the inner diameter of the vessel, on M-mode images in order to calculate circumferential Green-Lagrange cyclic strain. For a given M-mode acquisition, we chose 2 reflective lines, 1 along the anterior and 1 along the posterior vessel wall. We chose lines that could be tracked over multiple cardiac cycles so that we could make multiple inner-diameter measurements over time. We made a point of not making measurements when the animal was inhaling because the aorta undergoes significant motion.
We also acquired respiration- and cardiac-gated transaxial US volumes of the suprarenal aorta beginning inferior to the renal arteries and up to the diaphragm (3-cm total scan distance; 0.19-mm step size). Lastly, automatic frequency tracing over the peaks of pulsed-wave Doppler velocity waveforms was used in order to measure mean blood flow velocity over a cardiac cycle.
Tissue Collection
Rats were euthanized as indicated in Figure 1 (at the point where the line ends in each row). Rats used for histology (Cohorts 2a and 3) were pressure-perfused through the left ventricle, as described previously [23]. We excised the heart and aorta and allowed them to fix in 4% paraformaldehyde for 24 h. Tissue was kept in PBS until gross vessel dissection. We also collected the suprarenal aortas from 4 wild-type Sprague-Dawley rats (17 ± 7.6 weeks of age and 378 ± 83.2 g at sacrifice) for measurements of the cross-sectional area of the media.
Aortic Tissue Histology
We segmented suprarenal and ascending aortas prior to paraffin embedding, sectioning (5 μm), and staining (H&E, Verhoeff Van-Gieson [VVG], and Masson trichrome [MTC]). VVG and MTC stains were used to distinguish elastin bands (black) and collagen fibers (blue), respectively, from adjacent structures. We scanned images (×4 and ×10 magnification) for qualitative and quantitative analysis. For the latter, we measured the cross-sectional area of the media (between the inner and outer elastic layers) of each VVG-stained suprarenal aorta tissue section (ImageJ) [24]. Additionally, we examined ascending aortas from apoE-/- (n = 3; 442 ± 66 days of age) and wild-type (n = 3; 102 ± 28 days of age) rats that were fed regular chow and not infused with AngII. This location is the site for early development of atherosclerotic lesions and thoracic aortic aneurysms in mice [25,26].
Statistical Analysis
Data values are presented as mean ± standard deviation. We performed parametric and nonparametric tests to analyze statistical differences for Cohorts 1, 2, and 3 as well as wild-type rats at different time points. We used one-way analysis of variance (ANOVA) with post hoc tests (Dunnett and Tukey HSD) to analyze serially collected BP and total serum cholesterol data. We ran two-tailed Student t tests (unpaired and paired) to compare US-derived measurements, serum lipid levels, and values for the cross-sectional area of the aortic media. Additionally, we used the Kruskal-Wallis test followed by the Dunn multiple-comparisons test to analyze US-derived measurements for Cohort 2 and to compare across cohorts at a single time point. A p value ≤0.05 was considered significant. We performed power analysis for the expected change in aortic diameter for rats developing AAAs after surgery. Based on the current clinical diagnostic threshold of a 50% increase, we calculated that a sample size of 4 would be required to attain statistical power of at least 0.8 at an α value 0.05.
Results
Body Weight Gain and Animal Mortality
At the time of pump implantation for Cohort 1 (at 9 weeks of age), the average weight of the male rats (n = 8) was 315 ± 12.9 g and the 2 female rats weighed 217 and 224 g (online suppl. Fig. S4). The animals from Horizon Discovery (n = 9) had a similar weight (319 ± 7.8 g) at 9 weeks of age when pumps were implanted (online suppl. Fig. S4). At 28 weeks of age, the animals in Cohort 3 (n = 3) weighed 493 ± 40.2 g. At the same age, the male rats (n = 3) and 1 female rat in Cohort 1b weighed 497 ± 5.0 and 319 g, respectively. After the start of the HFD, the animals in Cohort 1b did not experience an increase in weight (online suppl. Fig. S4). Two animals in Cohort 1b (1 male and 1 female) died 5-7 weeks after the start of the HFD. One male animal in Cohort 2b also died after 6 weeks of AngII infusion. Details on these premature deaths are provided below.
Total Serum Cholesterol Measurements and en face Staining
We compared total serum cholesterol values from Cohorts 1b, 2, and 3 in order to measure the degree of dyslipidemia in this model (Table 1; online suppl. Table S1). The 20-week-old chow-fed rats (Cohort 1b) showed significantly higher serum cholesterol than the wild-type animals (190.5 ± 13.4 vs. 104.7 ± 14.2 mg/dL; p < 0.01). Cohort 1b also had statistically significant elevations in serum cholesterol levels over 6 weeks of HFD (267.5 ± 10.3, 203.4 ± 5.2, and 236.6 ± 8.9 mg/dL) relative to baseline and at time points during the HFD (p < 0.05), except for 1 intermediate time point. We observed substantial visceral fat during dissection of the 2 animals that died after 5-7 weeks on the HFD, suggesting that death might have been due to complications with the diet as observed by others [27,28,29]. Cohort 3 also had significantly higher serum cholesterol at 8 and 28 weeks of age (147.7 ± 8.4 and 136.1 ± 5.5 mg/dL) than the wild-type animals (p < 0.05). These values were similar to those measured in 2 rats at 9 weeks of age in Cohort 2 (145.1 and 127.1 mg/dL; online suppl. Table S1), but lower than those in Cohort 1b. Full serum analysis of a subset of rats further confirmed a significant shift in the lipid profiles between wild-type and apoE-/- rats (online suppl. Fig. S5, Table S1). Cholesterol and LDL were significantly elevated (6.9 ± 2.5-fold and 10.7 ± 3.2-fold) while HDL had a borderline significant reduction (0.5 ± 0.2-fold) in apoE-/- rats. LDL/HDL ratio was also significantly increased (20.8 ± 8.7-fold) for the apoE-/- rats. Taken together, our results demonstrate that apoE-/- rats have elevated total serum cholesterol and that these levels are sensitive to HFD. None of the aortas prepared en face showed appreciable atherosclerosis, as determined by minimal accumulation of Sudan IV stain on the luminal surface (online suppl. Fig. S6).
Elevation in BP with AngII Infusion
SBP, DBP, and MABP increased in all rats after pump implantation (online suppl. Table S1). As early as day 3 postimplantation, we measured increases in these values, and they began to plateau at day 14. In Figure 2, we have displayed SBP values as a function of animal age rather than days postimplantation. Compared to Cohort 1, baseline SBP values were higher for the age-matched Horizon Discovery animals in Cohort 2 (p = 0.043) and the older animals in Cohort 3 (p = 0.035). The elevation in SBP was statistically significantly different from baseline by day 14 for Cohorts 1 and 3 (Fig. 2a) and day 3 for Cohort 2 (Fig. 2b). The largest percentage increases were 60 ± 20% (Cohort 1), 40 ± 5% (Cohort 2), and 30 ± 4% (Cohort 3). For animals in Cohort 1b, the largest percentage increase relative to levels just prior to reimplantation was 29 ± 5%. Animals continuously infused with AngII for >4 weeks (Cohort 2b) had a statistically significant elevation in SBP that was sustained for 56 days (Fig. 2B). SBP was increased 50 ± 4% vs. baseline by day 21 after re-implantation. One male rat in Cohort 2b died after 6 weeks of AngII infusion. This animal experienced weight loss that could not be alleviated by saline injections. On necropsy, we found that it may have had an abdominal perforation leading to internal bleeding. We also found that the Sprague-Dawley wild-type rats (n = 10) not infused with AngII had BP similar to that of the apoE-/- rats prior to pump implantation (online suppl. Table S1). The rats in this study, therefore, showed baseline BP values similar to wild-type controls and moderate-to-severe hypertension in response to AngII.
Systolic blood pressure (SBP) measurements. All cohorts show a statistically significant elevation in SBP after AngII pump implantation (arrows). a SBP for Cohort 1 (weeks 8-13) and Cohorts 1b and 3 (weeks 29-34). b SBP for Cohort 2a (weeks 8-13) and Cohort 2b (weeks 13-18). The online supplementary S1 Table shows all individual data points for systolic, diastolic, and mean arterial BP measurements. ns, nonsignificant. * p < 0.05, ** p < 0.001, vs. baseline (one-way ANOVA with the Dunnett multiple-comparisons test).
Systolic blood pressure (SBP) measurements. All cohorts show a statistically significant elevation in SBP after AngII pump implantation (arrows). a SBP for Cohort 1 (weeks 8-13) and Cohorts 1b and 3 (weeks 29-34). b SBP for Cohort 2a (weeks 8-13) and Cohort 2b (weeks 13-18). The online supplementary S1 Table shows all individual data points for systolic, diastolic, and mean arterial BP measurements. ns, nonsignificant. * p < 0.05, ** p < 0.001, vs. baseline (one-way ANOVA with the Dunnett multiple-comparisons test).
Ultrasound Measurements
We observed no aortic dissections or AAAs over 28 and 56 days of AngII infusion. Across cohorts, suprarenal aortic diameter ranged between 1.70 and 2.61 mm at baseline to 1.65 and 2.98 mm at day 28 (Fig. 3). Older rats (Cohorts 1b and 3) had similar values over 28 days (p = 0.45 and p = 0.18, respectively). The aortas of younger rats (Cohorts 1 and 2) showed a small increase in diameter over 28 days (p = 0.046 and p = 0.054, respectively), which we attribute primarily to the growth of the animals as they aged between weeks 9 and 13. Over this period, 2 animals in Cohort 1 experienced the largest change in diameter (38 and 70% increase) among all animals. Animals in Cohort 2b had a statistically significant increase in aortic diameter after 56 days of AngII infusion (p < 0.001). The largest individual percentage increase in diameter over this period was 51%, but no focal enlargement was observed. Despite similar ages, baseline aortic diameter in Cohort 2 was significantly larger than in Cohort 1 (29 ± 3%; p < 0.001). A 3-dimensional rendering of segmentations from the suprarenal aorta of a rat from Cohort 3 is shown in the online supplementary Movie S1. The overall morphology and size of this aorta remained relatively normal after 28 days of AngII infusion.
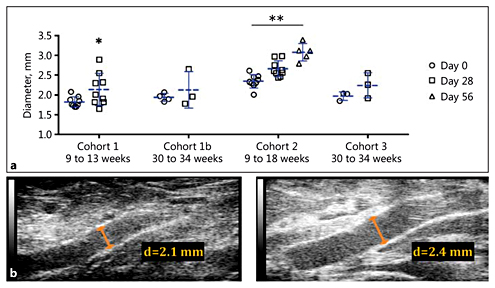
Suprarenal aortic diameter measurements. a Mean suprarenal aortic diameter increased over 28 or 56 days of AngII infusion. These changes were significant for Cohorts 1 and 2 but not for Cohorts 1b (p = 0.45) and 3 (p = 0.18). One animal in Cohort 1b died between implantation and sacrifice. b Representative long-axis B-mode images at days 0 and 28 for an animal in Cohort 3. d, diameter. * p < 0.05; ** p < 0.001 vs. day 0 (Student t test; Kruskal-Wallis test with Dunn multiple-comparisons test).
Suprarenal aortic diameter measurements. a Mean suprarenal aortic diameter increased over 28 or 56 days of AngII infusion. These changes were significant for Cohorts 1 and 2 but not for Cohorts 1b (p = 0.45) and 3 (p = 0.18). One animal in Cohort 1b died between implantation and sacrifice. b Representative long-axis B-mode images at days 0 and 28 for an animal in Cohort 3. d, diameter. * p < 0.05; ** p < 0.001 vs. day 0 (Student t test; Kruskal-Wallis test with Dunn multiple-comparisons test).
We found that animals in Cohorts 1, 2, and 3 had variable changes in mean blood flow velocity through the suprarenal aorta at day 28 relative to baseline (Fig. 4). Averaging these changes for the animals in each cohort, we measured small reductions in blood flow velocity. The 2 animals in Cohort 1 with the largest change in aortic diameter also had the largest decrease in mean blood flow velocity (44 and 45% decrease). The 3 animals in Cohort 3 experienced a 14 ± 2% increase in diameter alongside a statistically significant 33 ± 12% decrease in mean blood flow velocity.

Suprarenal blood flow velocity measurements. a Mean blood flow velocity did not change significantly after 28 or 56 days of AngII infusion (p > 0.05) except in Cohort 3. One animal in Cohort 1b died between implantation and sacrifice. b Representative pulsed-wave Doppler images at days 0 and 28 for an animal in Cohort 1b. * p < 0.05 vs. day 0 (Student t test).
Suprarenal blood flow velocity measurements. a Mean blood flow velocity did not change significantly after 28 or 56 days of AngII infusion (p > 0.05) except in Cohort 3. One animal in Cohort 1b died between implantation and sacrifice. b Representative pulsed-wave Doppler images at days 0 and 28 for an animal in Cohort 1b. * p < 0.05 vs. day 0 (Student t test).
Circumferential cyclic strain was significantly reduced at days 28 and 56 relative to baseline except for in Cohort 1b (Fig. 5). Comparing Cohort 3 (normal diet) with Cohort 1b (HFD), there was no significant difference in circumferential cyclic strain at days 0 (p = 0.051) or 28 (p = 0.174). As the animals in Cohort 1b were implanted with a second pump after the first had expired, we also analyzed the effect of repeat AngII infusion after a 17-week interruption. After this period of time, when no exogenous AngII was being delivered (between 13 and 30 weeks of age), BP (Fig. 2a) and circumferential cyclic strain (Fig. 5a) values for these animals shifted towards baseline values while the diameter increased slightly. Animals in Cohort 2 had a statistically significant reduction in circumferential cyclic strain after 28 days of AngII infusion (p < 0.001). This magnitude of reduction for the animals in Cohort 2b was similar after the second AngII infusion period (i.e., day 56). The 2 animals with the largest increase in aortic diameter also had the greatest reduction in circumferential cyclic strain (40 and 80% decrease).
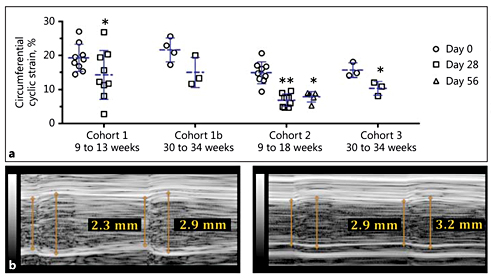
Suprarenal aortic circumferential cyclic strain measurements. a Suprarenal aortic circumferential cyclic strain significantly decreased after 28 days of AngII infusion in all cohorts except Cohort 1b (p = 0.077). Circumferential cyclic strain for Cohort 2b remained significantly reduced after 56 days. One animal in Cohort 1b died between implantation and sacrifice. b Representative M-mode traces at days 0 and 28 for an animal in Cohort 1b. * p < 0.05; ** p < 0.001 relative to day 0 (Student t test; Kruskal-Wallis test with Dunn multiple-comparisons test).
Suprarenal aortic circumferential cyclic strain measurements. a Suprarenal aortic circumferential cyclic strain significantly decreased after 28 days of AngII infusion in all cohorts except Cohort 1b (p = 0.077). Circumferential cyclic strain for Cohort 2b remained significantly reduced after 56 days. One animal in Cohort 1b died between implantation and sacrifice. b Representative M-mode traces at days 0 and 28 for an animal in Cohort 1b. * p < 0.05; ** p < 0.001 relative to day 0 (Student t test; Kruskal-Wallis test with Dunn multiple-comparisons test).
Histology
Suprarenal aortas exhibited healthy elastin and collagen structure (online suppl. Fig. S7A, B). This confirmed our in vivo observations that the aortic morphology remained mostly normal after 28 days of AngII infusion. We did, however, find that the medial layer became significantly larger (p = 0.0036) in rats infused with AngII than in those without AngII infusion (Fig. 6a, b). The mean cross-sectional area of the media was 1.6-fold greater in the AngII-infused group (0.70 ± 0.12 mm2; n = 8) than in rats without infusion (0.44 ± 0.1 mm2; n = 4; Fig. 6c). There was no statistically significant difference in the ages or weights of the animals between these groups. We also noted large nuclei in the aortic smooth muscle cells of rats infused with AngII (Fig. 6a; H&E). We observed no atherosclerotic plaques and healthy elastic lamellar units in the ascending aortas of older apoE-/- rats not infused with AngII (online suppl. Fig. S7C).
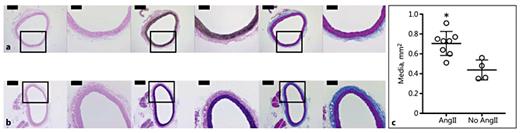
Histology and quantitative analysis of aortas from rats infused and not infused with AngII. H&E- (left), VVG- (middle), and MTC- (right) stained sections of suprarenal aortas from a rat in Cohort 3 (a) and a rat not infused with AngII (b). The boxes mark a magnified view that is shown on the right of each section. Scale bars, 500 μm (×4 magnification) and 200 μm (×10 magnification). The mean cross-sectional area of the media (c) of the suprarenal aortas of AngII-infused rats (n = 8; age: 6.7 ± 2.8 months; mass: 368 ± 53.5 g) was 1.6-fold greater (* p = 0.0036) than for rats not infused with AngII (n = 4; age: 4.3 ± 1.9 months; mass: 378 ± 83.2 g).
Histology and quantitative analysis of aortas from rats infused and not infused with AngII. H&E- (left), VVG- (middle), and MTC- (right) stained sections of suprarenal aortas from a rat in Cohort 3 (a) and a rat not infused with AngII (b). The boxes mark a magnified view that is shown on the right of each section. Scale bars, 500 μm (×4 magnification) and 200 μm (×10 magnification). The mean cross-sectional area of the media (c) of the suprarenal aortas of AngII-infused rats (n = 8; age: 6.7 ± 2.8 months; mass: 368 ± 53.5 g) was 1.6-fold greater (* p = 0.0036) than for rats not infused with AngII (n = 4; age: 4.3 ± 1.9 months; mass: 378 ± 83.2 g).
Discussion
Our studies demonstrate that apoE-/- rats develop a moderate cardiovascular disease phenotype but do not develop dissecting AAAs when infused with AngII. Our findings suggest that there are species-specific differences between mice and rats which, in response to ApoE-deficiency and atherosclerosis susceptibility, may explain why we did not observe AAA formation.
Species-Specific Differences between Rats and Mice
Rats have several physiological and morphological differences when compared to mice. Interestingly, however, the aorta of both species exhibits a leftward curvature above the right renal artery, which has been proposed as a determining factor for leftward expansion of AngII AAAs in mice [30,31]. In vivo circumferential cyclic strain is also similar in rats and mice, suggesting that there is similar pulsatile loading of the aorta [32]. Despite these factors, AAAs did not develop in apoE-/- rats infused with AngII. In light of the findings described here, there are 3 areas that can be explored further to understand AAA formation and development.
First, future work could focus on quantifying how blood flow and hemodynamic metrics, i.e., wall shear stress and oscillatory shear index [33,34], evolve between a healthy and diseased state. This can be accomplished by computational fluid dynamic modeling to investigate how regional differences in flow patterns influence vascular growth and remodeling of the aorta [35,36]. We have previously shown how biomechanical and hemodynamic factors are influenced after AngII AAA formation in mice [23]. However, the role that hemodynamics [4,37,38] and biomechanics [39,40] play in initiating the disease requires further investigation in animal models and humans.
Second, serum lipids and lipoproteins may impact cardiovascular disease development differently in apoE-/- mice and rats. Hyperlipidemic mice have a significantly larger fraction of non-HDL than wild-type mice [41]. A shift towards increased levels of total cholesterol and decreased levels of HDL is an important factor for atherogenesis and may influence AngII AAA development [42]. Wei et al. [43 ]recently reported that rats with a 14-bp apoE gene deletion had an LDL/HDL ratio in the serum of >4:1 after consuming a HFD for 12 weeks. They concluded that their rats did not spontaneously become hyperlipidemic and that a HFD and partial carotid ligation are necessary to promote atherogenesis. Therefore, further characterization of atherosclerosis in apoE-/- rats is certainly justified. We found that chow-fed apoE-/- rats have significantly higher serum cholesterol, LDL, and LDL/HDL ratio than wild-type rats, and that a HFD exacerbated the elevation in total serum cholesterol but did not lead to atherosclerosis. Future work would be needed to determine if a different HFD is necessary to shift the lipoprotein profile further towards a proatherogenic state. In agreement with other findings by Wei et al. [43], the aortas in our study showed no lipid accumulation or visible plaque on the luminal surface (online suppl. Fig. S6, S7). Taken together, these data suggest that the lack of atherosclerosis in apoE-/- rats may play a role in the absence of AAA formation. However, development of atherosclerotic lesions at the level of the suprarenal aorta has been shown to not be necessary for AAA development [44].
Third, a heightened response to AngII in rats versus mice entails several differences in physiology and vascular remodeling [21], further described below.
Effect of AngII on Physiology and Vascular Remodeling
The animals in this study became hypertensive relative to baseline levels (Fig. 2) over 28 days of subcutaneous infusion of exogenous AngII (200 ng/kg/min). We chose this dose based on previous studies on wild-type rats [21,45,46,47]. Cassis et al. [46 ]previously showed that higher doses of AngII had detrimental physiological effects including a loss of body weight. At a dose of 200 ng/kg/min, the animals in our study maintained their body weight while BP increases were consistent with those in previous works [21,45,46], confirming that the pumps eluted AngII properly. Past studies have also verified that saline-filled pumps implanted in rats do not cause a rise in BP [21,46]. Based on this work and our current findings with consistent baseline measurements, we did not implant apoE-/- rats with saline-filled pumps.
It is clear that AngII infusion promotes atherogenesis and is required for formation of AAAs in hyperlipidemic or wild-type mice [44,48,49]. In apoE-/- rats, however, it is not yet clear whether an optimized dosage of exogenous AngII would be sufficient to cause atherosclerosis and AAAs. Cassis et al. [21 ]extensively characterized how much less responsive C57BL/6 mice are to AngII than Sprague-Dawley rats are. One noteworthy difference between the species is evidence of medial hypertrophy and thickening in rats, but adventitial expansion in mice in response to AngII infusion [21]. Our images and quantification of medial-layer thickening confirm this finding in apoE-/- rats infused with AngII, compared to both the suprarenal aortas of rats not infused with AngII (Fig. 6) and previously published data for the thoracic [50,51] and infrarenal [52] aorta. Findings from other studies may also support this. Su et al. [53 ]provided evidence of the proliferation of smooth muscle cells in smaller rat arteries as a result of AngII infusion. Cao et al. [54 ]have also shown that AngII infusion in rats is associated with a significant increase in the density of AngII binding sites on the cells in vessel walls. Cassis et al. [21 ]reiterated this finding in their comparative animal study and concluded that, unlike in rats, there is “downregulation of AngII receptor density in mouse tissues following chronic AngII infusion”; this may partly explain why a more hypertensive response is seen in rats compared to mice for the same dosage of exogenous AngII.
Serum Cholesterol Levels
In planning our experiments, we decided to use standard chow, as Horizon Discovery described adverse effects and death in apoE-/- rats fed a HFD [20]. For Cohort 1b, however, we chose to place this subset of animals on a HFD with the goal of increasing their atherogenic potential. These rats did not show a change in weight after the start of the HFD (online suppl. Fig. S4). We cannot verify, however, that these animals had a low food intake, as we did not track this. Horizon Discovery has provided unpublished total serum cholesterol values for apoE-/- rats [20]. These levels are 2- to 3-fold higher than those in our age-matched rats (Cohorts 1b and 3) when consuming standard chow. This discrepancy may be due to the use of different assay kits. Cholesterol levels were similar in the apoE-/- rats we created and those bought commercially (Table 1; online suppl. Table S1). This indicates that our cholesterol assay is indeed detecting comparable values for total serum cholesterol in each knockout model. Additionally, the levels in the age-matched wild-type rats were significantly lower. Future experiments could investigate other atherogenic diets and serum cholesterol levels using a fluorimetric assay.
Ultrasound Imaging
From our analysis of US data and inspection of the gross morphology and cross-sectional histology of the aortas, we confirmed that no AAAs developed. However, suprarenal aortic diameter and mean blood flow velocity did show some statistically significant differences over time (Fig. 3, 4). A study from 2003 that used lower-frequency US to track experimental AAAs concluded that normal weight gain and aortic growth in rats could confound one's ability to determine aortic expansion over periods >14 days [55]. Natural growth should certainly be considered in analyzing serial measurements. That said, high-frequency US provides high resolution, which is adequate for identifying pathological expansion. In mice, AngII-induced AAAs are focal and saccular [8,23], which make them easy to distinguish from a healthy aorta. We did find that the circumferential cyclic strain of the suprarenal aorta was reduced relative to baseline in all cohorts (Fig. 5). These changes are likely due to the hypertension that occurred after AngII pump implantation, moving vessel loading up the stress-strain curve. Due to this increased load, more collagen may be deposited and remodeled, causing the aorta to become less compliant.
Conclusion
We have characterized the vascular pathology in young and old Sprague-Dawley rats with ApoE deficiency. The animals showed an increase in total serum cholesterol levels, particularly with HFD feeding, and a rise in BP after implantation of AngII miniosmotic pumps. We also found that animals had decreased suprarenal circumferential cyclic strain and larger medial layers, which we attribute to hypertension and arterial wall remodeling. Suprarenal aortas had preserved elastin and collagen structure after 28 days of infusion, but the cross-sectional area of the media became larger. However, we did not observe aortic dissection or focal enlargement of the suprarenal aorta, as has been observed in AngII-infused apoE-/- mice. Furthermore, we did not identify atherosclerotic plaques or lipid accumulation on the luminal surface of the aortas. Overall, these findings suggest that apoE-/- rats have a moderate cardiovascular disease phenotype that is resistant to atherosclerosis and AAA formation despite HFD administration and exogenous AngII infusion. Atherosclerosis may be a crucial initiating factor for AngII-induced AAAs, and we suspect there are several species-specific differences that explain why we see resistance to cardiovascular disease in rats. Future work will be needed to use our US data for computational fluid dynamic modeling and to analyze the presence of specific inflammatory cells in the aortic wall. In comparison to mice, a rat model has potential utility to help with translational studies involving biomedical devices, imaging, and experimental therapeutics.
Acknowledgments
We gratefully acknowledge Rebecca Houser and Judy Hallett in the Transgenic Mouse Facility at Purdue University for their help in creating and genotyping the transgenic rats. We also acknowledge the assistance of the Purdue University Histology Research Laboratory, a core facility of the NIH-funded Indiana Clinical and Translational Science Institute.
Disclosure Statement
There were no conflicts of interest.
Funding Sources
Funding was provided by an American Heart Association Scientist Development Grant (14SDG18220010) and the Indiana Clinical and Translational Sciences Institute, in part by Grant Number (UL1TR001108) from the National Institutes of Health, National Center for Advancing Translational Sciences, Clinical and Translational Sciences Award to CJG. The content is solely the responsibility of the authors and does not necessarily represent the official views of the National Institutes of Health.
