

Abstract
Recent studies about the structural variation of genomic sequences have shown that there is a large amount of copy number variations (CNVs) of genes within species. Analyzing Redon et al.’s (2006) crude data on copy number variable regions (CNVRs), we previously showed that CNVs are particularly high for chemosensory receptor genes in human populations. In this paper, we reanalyzed the CNVs of these genes using more refined data by Perry et al. (2008). The results showed that the extent of CNVs is somewhat lower in this dataset than in the previous one, but that the extent is still substantial for olfactory receptor (OR), vomeronasal receptor (VR), and taste receptor (TR) genes. We also studied the CNVs for chemosensory receptor genes in mice, using CNVR data obtained from inbred strains. It was found that the extent of CNVs is quite substantial but is lower than that for human populations. However, because the mouse data came from inbred strains and might be biased, this conclusion should be regarded as tentative. Despite this reservation, the distribution of gene copy number for the OR gene family was approximately normal in both humans and mice, suggesting that genomic drift caused by random duplication and deletion of genes plays important roles in determining the evolutionary change of chemosensation.
Introduction
Traditionally population genetics has been concerned with the extent of polymorphism and the evolutionary change of allelic frequencies in populations. Recently, however, it has become clear that extensive polymorphism exists not only in allelic frequencies but also in the form of gene copy number per genomic region (e.g., Iafrate et al., 2004; Sebat et al., 2004; Tuzun et al., 2005). For example, the genomic region of natural killer cell receptor (KIR) genes contains about 16 genetic loci in the human genome, but there are more than 20 different haplotypes containing different sets of KIR genes in the human population (Hsu et al., 2002). This indicates a substantial amount of copy number variation (CNV) of KIR genes among different individuals. There are many other such genomic regions in the human genome. However, the extent and evolutionary significance of CNVs are still largely unexplored at present.
We have become interested in the intraspecific CNVs in relation to the long-term evolution of gene copy number in several different multigene families. In a study of mammalian olfactory receptor (OR) genes, we found that there are extensive copy number differences among mammalian species and these differences are caused by large numbers of gains and losses of genes that occur in the evolutionary process (Niimura and Nei, 2007). This finding led us to postulate that there must be extensive CNVs for chemosensory receptor gene families (including the OR gene family) within mammalian species. We have then shown that this is indeed the case with chemosensory receptor gene families in human populations, and these large CNVs are mainly due to genomic drift caused by random duplication and deletion of genes (Nei, 2007; Nozawa et al., 2007).
In the study of Nozawa et al. (2007), we used data of copy number variable regions (CNVRs) from 270 humans studied by Redon et al. (2006) (referred to as Redon’s data in the following). In this dataset, however, the boundaries of CNVRs and copy number monomorphic regions (CNMRs) were ambiguous. In fact, Redon et al. (2006) discussed the possibility of an overestimation of the size of an inferred CNVR. For this reason, our estimates of CNVs of chemosensory receptor genes may have been too high. Recently, Perry et al. (2008) reported more refined data about CNVRs in 30 humans (ten individuals from African, Asian, and European populations each) (Perry’s data in the following). They used an array-based comparative genomic hybridization platform which targeted the previously identified CNVRs, and determined the boundaries of CNVRs and CNMRs more accurately with a resolution of 1 kb (Fig. 1). We therefore decided to reanalyze the CNVs for chemosensory receptor gene families using the new dataset and compare the results with our previous ones. In addition, we investigated the CNVs of chemosensory receptor genes in mice using the genome-wide CNVR data from 42 inbred strains reported by Cutler et al. (2007).

Example of copy number variable regions (CNVRs) that can be identified by the procedures of Redon et al. (2006) and Perry et al. (2008). Redon et al. (2006) used large sequences (>100 kb) as probes. Therefore, even if only a fraction of a sequence is variable with respect to copy number, the entire region of the sequence may be reported as a CNVR and some copy number monomorphic regions (CNMRs) may be misidentified as CNVRs (A). By contrast, Perry et al. (2008) considered only previously identified CNVRs and used oligonucleotide probes with high density (∼1-kb spacing), and therefore they could identify the boundaries between CNVRs and CNMRs more accurately (B). In this example, a genomic region including genetic loci 1 to 6 in the standard genome is identified as a CNVR (VR, blue) in Redon’s data (A). In Perry’s data, however, the genomic region including genetic loci 4 and 5 is detected as a CNMR (MR, red) (B). Therefore, one CNVR in Redon’s data is decomposed into one CNMR and two CNVRs (VR1 and VR2) in Perry’s data. Consequently, the number of copy number polymorphic loci (CNPLs, filled boxes) in Perry’s data is three for VR1 and one for VR2, whereas CNMR contains two copy number monomorphic loci (CNMLs, open boxes). VR1 containing three genetic loci is assumed to be deleted in individual b (dotted line). VR2 containing locus 6 is assumed to be duplicated in individual c (blue line).
Example of copy number variable regions (CNVRs) that can be identified by the procedures of Redon et al. (2006) and Perry et al. (2008). Redon et al. (2006) used large sequences (>100 kb) as probes. Therefore, even if only a fraction of a sequence is variable with respect to copy number, the entire region of the sequence may be reported as a CNVR and some copy number monomorphic regions (CNMRs) may be misidentified as CNVRs (A). By contrast, Perry et al. (2008) considered only previously identified CNVRs and used oligonucleotide probes with high density (∼1-kb spacing), and therefore they could identify the boundaries between CNVRs and CNMRs more accurately (B). In this example, a genomic region including genetic loci 1 to 6 in the standard genome is identified as a CNVR (VR, blue) in Redon’s data (A). In Perry’s data, however, the genomic region including genetic loci 4 and 5 is detected as a CNMR (MR, red) (B). Therefore, one CNVR in Redon’s data is decomposed into one CNMR and two CNVRs (VR1 and VR2) in Perry’s data. Consequently, the number of copy number polymorphic loci (CNPLs, filled boxes) in Perry’s data is three for VR1 and one for VR2, whereas CNMR contains two copy number monomorphic loci (CNMLs, open boxes). VR1 containing three genetic loci is assumed to be deleted in individual b (dotted line). VR2 containing locus 6 is assumed to be duplicated in individual c (blue line).
The gene families studied were for ORs, trace amine-associated receptors (TAARs), vomeronasal receptors (V1Rs and V2Rs), and taste receptors (T1Rs and T2Rs). ORs and TAARs mainly recognize odorants in the environment (Buck and Axel, 1991; Liberles and Buck, 2006), whereas V1Rs and V2Rs are important for detecting pheromones which are chemical cues released and perceived by different individuals of the same species (Dulac and Axel, 1995; Herrada and Dulac, 1997; Matsunami and Buck, 1997). T1Rs and T2Rs are essential for detecting taste substances (Hoon et al., 1999; Adler et al., 2000; Matsunami et al., 2000).
The purpose of this article is to report the results of these studies with humans and mice.
Materials and methods
In the study of CNVs, the genome sequence is divided into CNVRs and CNMRs, and CNVRs are investigated in detail to find copy number polymorphic loci (CNPLs). Here a CNPL is a genetic locus of the standard genome that is polymorphic with respect to copy number when many individuals are studied (Fig. 1). In our previous paper (Nozawa et al., 2007), CNPLs were called copy number polymorphic genes (CNPGs). A CNPL is generated either by deletion (genetic loci 1, 2, and 3 in Fig. 1B) or duplication (genetic locus 6). In practice, CNVRs were examined between the reference individual and a sampled individual by using comparative genomic hybridization, and all CNVRs were mapped to the standard genome.
To measure the extent of CNVs of chemosensory receptor genes, we followed Nozawa et al. (2007) and used the proportion of CNPLs, the mean of the absolute copy number differences for all pairs of individuals compared (MD), the standard deviation of gene copy number (SD), MD relative to the gene number in the standard genome (MDRG), and SD relative to the gene number in the standard genome (SDRG). MDRG and SDRG were designed to minimize the effect of the number of genes on MD and SD, respectively. If the gene number in the standard genome is equal to the average number of gene copies for all individuals studied, SDRG becomes equal to the coefficient of variation. In addition, if the gene copy number is more or less normally distributed, MD and SD or MDRG and SDRG are nearly the same. Otherwise, however, they may be quite different.
It should be noted that Redon et al. (2006) and Perry et al. (2008) determined the CNVRs based on the human genome assembly hg17 (build 35), which was different from the assemblies (hg15, hg16, or hg18) used for the identification of chemosensory receptor genes in the previous studies (OR, Niimura and Nei, 2003; TAAR, Lindemann et al., 2005; V1R, Young et al., 2005; V2R, Young and Trask, 2007; T1R, Liao and Schultz, 2003; and T2R, Go et al., 2005). We already reexamined the genomic locations of OR, V1R, and T2R genes in hg17 in our previous study (Nozawa et al., 2007). In this study, we therefore reexamined the genomic locations of TAAR, V2R, and T1R genes using the same procedures. Similarly, we also reexamined the genomic locations of all chemosensory receptor genes in the standard mouse genome assembly mm7 (build 35) using each of the genes previously identified (OR, Niimura and Nei, 2005; TAAR, Lindemann et al., 2005; V1R, Zhang and Firestein, 2007; V2R, Young and Trask, 2007; T1R, Hoon et al., 1999; and T2R, Go et al., 2005) as a query. The genomic locations of chemosensory receptor genes in humans (hg17) and mice (mm7) are shown in supplementary tables. All CNPLs are also listed in supplementary tables (see www.karger.com?doi=10.1159/000184716).
Results
CNVs of chemosensory receptor genes in humans
Because both Redon’s and Perry’s data on CNVRs come from the individuals in the HapMap project (Frazer et al., 2007), we compared the CNVs of chemosensory receptor genes using the same 30 individuals from African, Asian, and European populations. Table 1 shows that in all but TAAR and T1R genes, MD is smaller in Perry’s data than in Redon’s. However, even in Perry’s data MD is quite large for OR, V1R, and T2R genes. The maximum copy number difference between two individuals was 28 for functional OR genes and five for functional T2R genes. In addition, MDRG is similar for functional and nonfunctional OR or T2R genes. In TAAR genes, we found no CNVs in both datasets. MDRG of T1R genes is comparable to that of OR genes in Perry’s data, but this value is caused by a single deviant individual.

The proportions of CNPLs for the OR, T2R, V1R, and V2R gene families are shown in Fig. 2. The proportions are lower in Perry’s data than in Redon’s in all cases. For example, the proportion of CNPLs for functional OR genes is 16.1% in Redon’s data but 13.8% in Perry’s. In other gene families, the difference is even greater. However, even in Perry’s data the proportion of CNPLs is high, and there is no significant difference between functional and nonfunctional OR or T2R genes (P = 0.06 and 0.57, respectively, by χ2 test). We could not conduct this type of comparison for V1R and V2R genes because all V1R and V2R genes in humans are considered to be nonfunctional (Zhang and Webb, 2003), although some intact V1R genes may be functional as olfactory receptors (Shirokova et al., 2008).
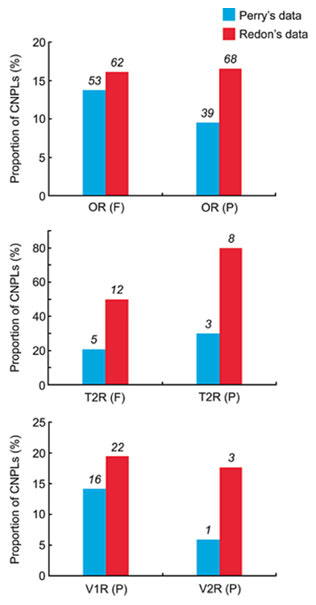
Proportions of CNPLs for OR, T2R, V1R, and V2R genes among 30 humans. Blue and red columns are the estimates obtained by Perry’s and Redon’s datasets, respectively. F: functional genes, P: pseudogenes. Numerals above the columns represent the number of CNPLs.
Proportions of CNPLs for OR, T2R, V1R, and V2R genes among 30 humans. Blue and red columns are the estimates obtained by Perry’s and Redon’s datasets, respectively. F: functional genes, P: pseudogenes. Numerals above the columns represent the number of CNPLs.
Figure 3 shows the distribution of the relative copy numbers for OR genes among the 30 individuals when a European individual (NA10851) was used as the reference individual. SD is smaller in Perry’s data than in Redon’s, especially for functional OR genes. However, the distribution is nearly normal in both datasets, which suggests that the evolutionary change of gene copy number is caused by genomic drift (Nozawa et al., 2007). In addition, SDRG is similar between functional and nonfunctional OR genes even in Perry’s data (Table 1). In fact, there is no significant difference in the variance of copy number between functional and nonfunctional OR genes in Perry’s data (P = 0.14 by F test) as well as in Redon’s (P = 0.90).

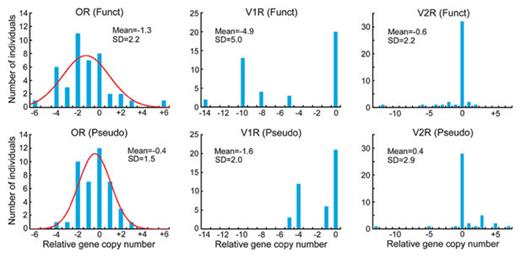
Distributions of relative copy number of OR genes among 30 humans. The relative copy number represents the copy number difference between a sampled individual and the reference individual. Mean and SD represent the mean and the standard deviation of gene copy number, respectively. The curves in the figures represent the normal distributions fitted to the actual data. None of the distributions is significantly deviated from normality.
Distributions of relative copy number of OR genes among 30 humans. The relative copy number represents the copy number difference between a sampled individual and the reference individual. Mean and SD represent the mean and the standard deviation of gene copy number, respectively. The curves in the figures represent the normal distributions fitted to the actual data. None of the distributions is significantly deviated from normality.
These results suggest that the extent of CNVs of chemosensory receptor genes in our previous study (Nozawa et al., 2007) is somewhat overestimated. However, the CNVs are still very large in OR, V1R, and T2R genes. More importantly, the CNVs are similar for functional and nonfunctional OR or T2R genes even in Perry’s data. Because the evolution of pseudogenes should occur in a neutral fashion, this observation suggests that functional OR genes are also evolving in a more or less neutral fashion by means of random gene duplication and deletion (or inactivation).
CNVs of chemosensory receptor genes in mice
To obtain some ideas about the CNVs of chemosensory receptor genes in other species, we examined the CNVs of these genes in mice. The results obtained are presented in Table 2. MD is 2.4 for functional OR genes and 1.7 for OR pseudogenes. In the most extreme case, one individual showed 12 more functional OR genes than the other. MD for V1R genes is greater than that for OR genes, though the number of gene copies is much smaller in V1R genes than in OR genes for both functional genes and pseudogenes. In the case of functional V1R genes, the maximum difference of copy number between two individuals was 14. MD is also quite large in V2R genes. Table 2 shows that MDRG is smaller for functional OR genes than for OR pseudogenes. By contrast, it is much greater in functional V1R genes than in V1R pseudogenes. MDRG is similar for functional and nonfunctional V2R genes. With respect to TAAR, T1R, and functional T2R genes, we found no CNVs in mice. MDRG of T2R pseudogenes is larger than that of OR genes, but this large value is caused by a single deviant individual.

Figure 4 shows the proportions of CNPLs for OR, V1R, and V2R genes among 42 mice. Overall, V1R and V2R genes show higher proportions of CNPLs than OR genes, though the number of CNPLs is greater in OR genes than in V1R or V2R genes. In OR and V2R genes, the proportion of CNPLs is essentially the same for both functional and nonfunctional genes (P = 0.64 and 0.50, respectively, by χ2 test). By contrast, the proportion is greater in functional V1R genes than in V1R pseudogenes (P = 0.02).
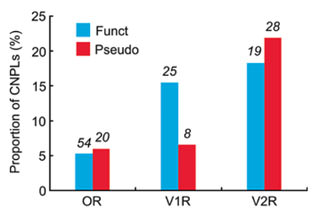
Proportions of CNPLs for OR, V1R, and V2R genes among 42 mice. Blue and red columns represent the proportions of CNPLs for functional genes and pseudogenes, respectively. Numerals above the columns represent the number of CNPLs.
Proportions of CNPLs for OR, V1R, and V2R genes among 42 mice. Blue and red columns represent the proportions of CNPLs for functional genes and pseudogenes, respectively. Numerals above the columns represent the number of CNPLs.
The distributions of relative copy numbers for OR, V1R, and V2R genes among 42 mice are presented in Fig. 5. In the study of Cutler et al. (2007), mouse strain C57BL/6J was used as the reference. The distributions of OR genes approximately follow the normal distribution as in the case of humans, whereas the distributions of V1R and V2R genes do not. SDRG is smaller in functional OR genes than in OR pseudogenes (Table 2). By contrast, SDRG is greater in functional V1R genes than in V1R pseudogenes, but it is similar for functional and nonfunctional V2R genes. It should be mentioned that all sampled strains show an equal or smaller number of V1R genes compared with the reference strain. Since the standard genome sequence was determined by using the reference strain (C57BL/6J), the smaller number of V1R genes in sampled strains appears to be due to gene deletions in sampled strains.
These results suggest that the CNVs of chemosensory receptor genes are also large in mice and genomic drift is an important factor in the evolution of these gene families. Because the extent of CNVs is different between functional and nonfunctional OR or V1R genes, some selection or nonrandom gene duplication and deletion may have affected the extent of CNVs. However, the interpretation is not so simple, because the CNVR data in mice come from inbred strains.
Comparison of CNVs of chemosensory receptor genes in humans and mice
Comparison of the CNVs of chemosensory receptor genes between humans and mice indicates that MDRG and SDRG for OR genes are 2–3% irrespective of the datasets in humans (Table 1), whereas in mice they are much less than 1% in both functional and nonfunctional genes (Table 2). In addition, the proportion of CNPLs for human OR genes (9–17%) is greater than that for mouse OR genes (∼5%) (Figs. 2 and 4). T2R genes also show a similar trend. We found a substantial amount of CNVs of T2R genes in humans (Table 1 and Fig. 2), whereas there was virtually no CNV in mouse T2R genes (Table 2). In V1R and V2R genes, however, CNVs are abundant in both humans and mice (Tables 1 and 2), though all V1R and V2R genes are thought to be nonfunctional in humans. For TAAR and T1R genes, there was virtually no CNV in both humans and mice.
The above results suggest that human populations generally contain a larger amount of CNVs than mouse populations especially for OR and T2R genes. These results could be reasonable. Mice are nocturnal animals, and they appear to be more dependent on chemosensation rather than vision. In contrast, humans are vision-oriented and have trichromatic vision unlike mice, which are dichromatic (Bowmaker, 1991). Therefore, the functional relaxation of OR and T2R genes may have enhanced the extent of CNVs of these genes in humans. However, there are a couple of problems in the comparison of CNVs between the two species. First, the mouse strains used here are artificially raised inbred strains rather than a random sample from natural populations, unlike the human individuals examined. Therefore, mouse data may not be comparable with human data. Second, the numbers of functional and nonfunctional genes are quite different between humans and mice. MDRG and SDRG were originally designed to reduce the effect of the number of genes on MD and SD, respectively, and they appeared to be appropriate for the comparison of closely related species such as humans and chimpanzees (Nozawa et al., 2007). In the comparison of humans and mice, however, the difference in copy number is very large for both functional genes and pseudogenes. For example, the number of functional OR genes is 388 in humans but 1,037 in mice, whereas the corresponding numbers of pseudogenes are 414 and 354, respectively (Niimura and Nei, 2005). In this case, MDRG and SDRG may not be appropriate measures for the comparison. In other words, the large values of MDRG and SDRG for functional OR genes in humans may have been caused by a smaller number of functional genes in humans than in mice. However, this interpretation alone is not sufficient, because MD and SD are also greater in humans than in mice. The relationship between MD (or SD) and MDRG (or SDRG) appears to be complex.
Despite the above reservations, the overall comparison of different measures of CNVs suggests that humans are more variable than mice with respect to the copy number of chemosensory receptor genes. To confirm this observation, however, it is necessary to conduct further studies using randomly sampled mice from natural populations.
Discussion
We have previously shown that the human population contains a large amount of CNVs with respect to chemosensory receptor genes (Nozawa et al., 2007). These results were obtained by using Redon’s crude CNVR dataset. Our reanalysis of human CNVs using Perry’s more refined data showed that the extent of CNVs is a little lower but is still substantially high. We have also studied the extent of CNVs for chemosensory receptor genes in mice using the CNVR data from 42 inbred strains. The results obtained showed that the extent of CNVs in this species is substantial, but is generally lower than that of humans. However, this could be due to the nonrandom sampling of individuals from the mouse population. Actually, it has been reported that most inbred strains used for studying CNVRs in mice were derived from a small number of individuals and have diverged during the last 3,000 years (Goios et al., 2007). It is therefore important to study this problem by using a new set of randomly chosen mouse individuals from natural populations.
In this paper we have studied the extent of CNVs for chemosensory receptor genes, especially OR genes, of which the number of gene copies is large and is known to be subject to genomic drift in the evolutionary process (Niimura and Nei, 2007; Nozawa et al., 2007). This genomic drift appears to cause both adaptive and random evolution when the long-term evolution encompassing different groups of vertebrate species is considered (Nei, 2007; Nozawa et al., 2007; Nei et al., 2008). However, the CNVs within species appear to be more or less neutral at least in the case of OR genes, because the distribution of copy number is not deviated from normality for both functional and nonfunctional genes.
Of course, this does not mean that the copy number of OR genes is unimportant for determining the ability of olfaction. On the contrary, there are several studies showing that the variation of olfactory sensitivity is controlled by OR genes in humans (Keller et al., 2007; Menashe et al., 2007) and mice (Griff and Reed, 1995). In addition, a number of ORs have been shown to be important for recognizing particular odorants in humans (e.g., Wetzel et al., 1999; Spehr et al., 2003; Schmiedeberg et al., 2007) and mice (e.g., Krautwurst et al., 1998; Kajiya et al., 2001; Abaffy et al., 2007). Yet, the genetic variation in OR genes may not affect the fitness or the expected number of offspring per individual appreciably, because the fitness is determined by many other characters in addition to olfaction. This issue has recently been reviewed by Nei et al. (2008).
Acknowledgements
We thank Yoshihito Niimura for valuable comments on earlier versions of the manuscript.
References
This work was supported by NIH Grant GM020293 to M.Nei.
