

Abstract
Background: The wide use of genome wide association studies (GWAS) has led to the successful identification of multiple genetic susceptibility variants to several complex human diseases. Given the limited amount of data on genetic variation at these loci in populations of non-European origin, we investigated population variation among 11 population groups for loci showing strong and consistent association from GWAS with several complex human diseases. Methods: Data from the International HapMap Project Phase 3, comprising 11 population groups, were used to estimate allele frequencies at loci showing strong and consistent association from GWAS with any of 26 complex human diseases and traits. Allele frequency summary statistics and FST at each locus were used to estimate population differentiation. Results: There is wide variation in allele frequencies and FST across the 11 population groups for susceptibility loci to these complex human diseases and traits. Allele frequencies varied widely across populations, often by as much as 20- to 40-fold. FST, as a measure of population differentiation, also varied widely across the loci studied (for example, 0.019 to 0.201 for type 2 diabetes, 0.022 to 0.520 for prostate cancer loci, and 0.006 to 0.520 for serum lipid levels). Conclusions: The public health risk posed by any of these risk alleles is likely to show wide variation across populations simply as a function of its frequency, and this risk difference may be amplified by gene-gene and gene-environment interactions. These analyses offer compelling reasons for including multiple human populations from different parts of the world in the international effort to use genomic tools to understand disease etiology and differential distribution of diseases across ethnic groups.
Introduction
The recent adoption and implementation of genome wide association studies (GWAS) has led to the successful identification of multiple genetic susceptibility variants to several complex human diseases. GWAS, conducted with panels comprising hundreds of thousands of single nucleotide polymorphisms (SNPs), have rapidly led to the discovery of strong and consistent associations with multiple complex diseases, including type 2 diabetes (T2D), stroke, obesity, and various types of cancer. Most GWAS have been conducted in populations of European ancestry, and it is only quite recently that GWAS are being done in other world populations. Therefore, data on variation in genotype frequencies and on genotype-phenotype associations at these newly discovered loci remain quite limited for many human population groups. Among other factors, the contribution of a specific variant to disease susceptibility in a population is limited by its frequency. Various forces, including genetic drift, gene flow, mutation, selection, and admixture, shape the population frequencies at any given locus. Given each population group’s unique genetic and demographic history, it is essential to estimate the prevalence of disease risk variants rather than to assume that the findings from one population are directly applicable to other populations. In this paper we report the findings of an investigation of the spectrum of allele frequencies and population differentiation in loci showing strong and consistent evidence for association with 26 complex human diseases and traits using data from the International HapMap Project’s HapMap Phase 3 data.
Methods
The loci studied were SNPs shown to be associated with 26 complex human diseases and traits in large, well-designed, and replicated GWAS as outlined in the NHGRI Catalog of Published Genome Wide Association Studies (http://www.genome.gov/ 26525384, accessed March 3, 2009). This database was used because it provides information on independent associations from GWAS meeting fairly stringent criteria, including: (a) the GWAS must have attempted at least 100,000 SNPs in the initial stage; (b) SNP-trait associations listed are limited to those with p values <9.5 × 10⁻⁶ and not previously reported; (c) only one SNP within a gene or region of high linkage disequilibrium is recorded unless there was evidence of independent association; and (d) studies focusing only on candidate genes were excluded from the catalog. The diseases and traits covered a wide range of diseases (such as type 2 diabetes, obesity, multiple sclerosis, breast cancer, lung cancer, panic disorder, Alzheimer’s disease) and measured traits (including height, serum lipids, and C-reactive protein). For the purposes of these analyses, similar phenotypes were grouped together (for example, ‘obesity’ included any entry with obesity as well as body mass index, waist circumference, and similar obesity-related traits, while ‘bone mineral density’ included ‘bone mineral density’ as well as ‘bone mineral density (spine)’ and ‘bone mineral density (hip)’). The full list of the diseases and traits is shown in table 1.
Summary of FST and minor allele frequency (MAF) for the GWAS loci for all 26 diseases/traits studied
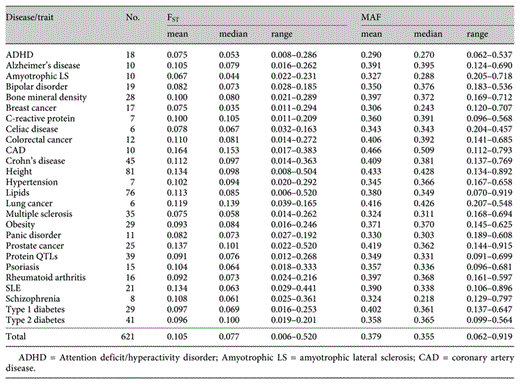
Genotype data for associated SNPs reported in the NHGRI Catalog of Published Genome Wide Association Studies were extracted from the International HapMap Project (http://www. hapmap.org) Phase 3 dataset, initially released July 01, 2008. This dataset included data from 11 populations, namely ASW (African ancestry in Southwest USA), CEU (Utah residents with Northern and Western European ancestry from the CEPH collection), CHB (Han Chinese in Beijing, China), CHD (Chinese in Metropolitan Denver, Colo.), GIH (Gujarati Indians in Houston, Tex.), JPT (Japanese in Tokyo, Japan), LWK (Luhya in Webuye, Kenya), MEX (Mexican ancestry in Los Angeles, Calif.), MKK (Maasai in Kinyawa, Kenya), TSI (Tuscans in Italy), and YRI (Yoruba in Ibadan, Nigeria). Only SNPs having frequencies in 9 or more populations were included in this analysis, giving a set of 621 SNPs out of the total number of 673 GWAS-associated SNPs in the NHGRI Catalog of Published Genome Wide Association Studies that are also in the HapMap Phase 3 dataset. Annotations for the SNPs were updated using Ensembl (http://www.ensembl.org) release 53 (March 04, 2009). The full list of SNPs and their annotations are shown in supplementary table 1 (www.karger.com?doi=10.1159/000218711). Genotypes of founders only were used for the estimation of allele frequencies [1] for a reference allele (A1), which is the minor allele in most populations. For convenience, this is referred to as the minor allele frequency (MAF). The Wahlund’s FST statistic was estimated as a measure of population differentiation in allele frequencies.
Results
The frequencies for reference alleles at each of these associated genetic loci varied considerably across the 11 populations as shown in figure 1. For example, as a group, the 10 amyotrophic lateral sclerosis loci varied in mean MAF from 0.205 to 0.718, and the 41 type 2 diabetes loci varied in mean MAF from 0.099 to 0.564. These differences are also present at the individual locus level. For example, the TCF7L2 locus for type 2 diabetes (rs7901695) had a C allele frequency that ranged from 0.013 to 0.488, with a nearly 40-fold difference in allele frequency between the population groups at the extremes of the distribution (Chinese, CHB, and African ancestry, ASW, respectively). Similarly, the FTO locus (rs9939609) for obesity ranged from 0.131 to 0.621 across the populations. In fact, the minor allele in some populations is often the major allele in at least one other population. FST, as a measure of population differentiation, varied widely across the loci studied. For example, FST for type 2 diabetes loci ranged from 0.019 to 0.201 and 0.022 to 0.520 for prostate cancer loci (table 1). About one-third of the loci (31%) had FST values less than 0.05, while 47% had FST values between 0.05 and 0.15 (moderate differentiation), 15% had FST values between 0.15 and 0.25 (great differentiation), and 7% had an FST value of 0.25 or greater. The distribution of FST values by disease/trait is shown in figure 2 and its distribution across all 621 loci is shown in supplementary figure 1.
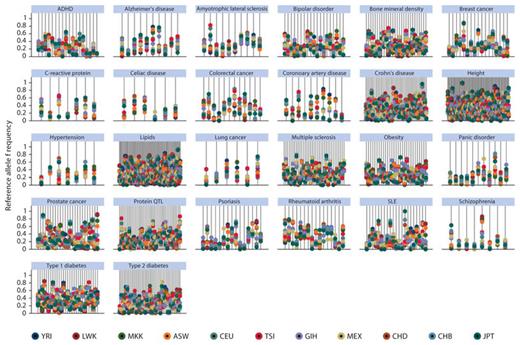
Allele frequency for each susceptibility locus across all 11 HapMap populations grouped by disease/trait. Each line represents a SNP and the allele frequencies for each population are plotted as colored dots along the line. The legend shows the color code for the populations. ASW (African ancestry in Southwest USA), CEU (Utah residents with Northern and Western European ancestry from the CEPH collection), CHB (Han Chinese in Beijing, China), CHD (Chinese in Metropolitan Denver, Colorado), GIH (Gujarati Indians in Houston, Texas), JPT (Japanese in Tokyo, Japan), LWK (Luhya in Webuye, Kenya), MEX (Mexican ancestry in Los Angeles, California), MKK (Maasai in Kinyawa, Kenya), TSI (Tuscans in Italy), and YRI (Yoruba in Ibadan, Nigeria).
Allele frequency for each susceptibility locus across all 11 HapMap populations grouped by disease/trait. Each line represents a SNP and the allele frequencies for each population are plotted as colored dots along the line. The legend shows the color code for the populations. ASW (African ancestry in Southwest USA), CEU (Utah residents with Northern and Western European ancestry from the CEPH collection), CHB (Han Chinese in Beijing, China), CHD (Chinese in Metropolitan Denver, Colorado), GIH (Gujarati Indians in Houston, Texas), JPT (Japanese in Tokyo, Japan), LWK (Luhya in Webuye, Kenya), MEX (Mexican ancestry in Los Angeles, California), MKK (Maasai in Kinyawa, Kenya), TSI (Tuscans in Italy), and YRI (Yoruba in Ibadan, Nigeria).
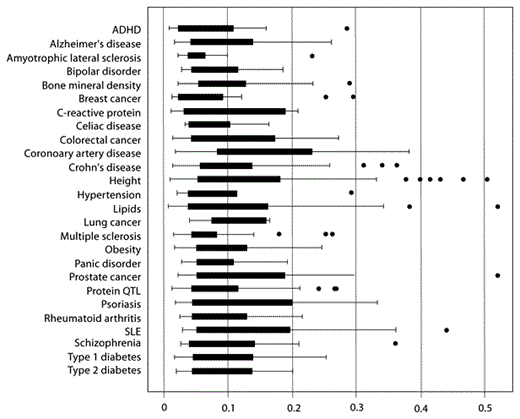
Boxplots showing distribution of FST values by disease/trait. The dots represent outliers or extreme values.
Boxplots showing distribution of FST values by disease/trait. The dots represent outliers or extreme values.
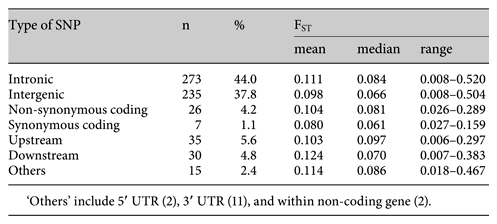
Allele frequencies tended to correlate better within groups that share continental ancestry or have existed in close geographical proximity to each other as shown in figure 3 (also see supplementary table 2). Thus, there were similar allele frequencies at most loci between the Southeast Asian groups (CHB, CHD, JPT), between the European groups (CEU, TSI), and between the African ancestry groups (YRI, LWK, MKK, ASW), but not between groups across these continental origin groupings. The commonest location of the risk loci is intronic (44%) and over one-third (38%) of the risk loci are intergenic, as shown in table 2. Only about 5% are coding SNPs, and only 4% code for a non-synonymous amino acid change. While the intergenic, intronic, and downstream SNPs seem to show more variability in FST values than the other SNP categories (table 2, fig. 4), this is not statistically significant (Kruskal-Wallis H 5.684, p = 0.46), although this conclusion is limited by the small numbers in most of the categories.
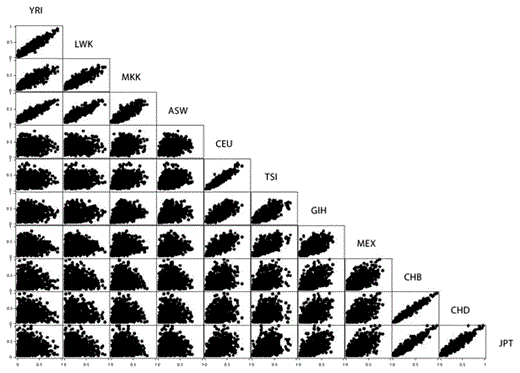
Pair-wise population scatter diagram showing correlation between allele frequencies across all 621 loci. Abbreviations of the different groups are the same as in figure 1.
Pair-wise population scatter diagram showing correlation between allele frequencies across all 621 loci. Abbreviations of the different groups are the same as in figure 1.

Distribution of FST values by type of SNP. NS_coding: non-synonymous coding, SYN_coding: synonymous coding.
Distribution of FST values by type of SNP. NS_coding: non-synonymous coding, SYN_coding: synonymous coding.
Discussion
GWAS have provided a major boost to complex disease genetics in rapidly identifying novel susceptibility risk loci that had hitherto not been found using linkage, candidate genes, or other approaches. However, most GWAS to date have been done in populations of European ancestry and the potential burden of risk posed by these loci to other populations is unknown. A first step in understanding this issue is the investigation of the allele frequency across multiple populations, as we have done for this large set of 621 loci associated with 26 common complex diseases and traits. The present study has demonstrated wide between-population variation as well as a lack of correlation in allele frequencies between the groups of European ancestry versus the non-European groups. These observations appear to be true for a wide variety of diseases considered in this study, including various types of cancer (e.g., breast cancer, prostate cancer, colorectal cancer), metabolic disease (e.g., type 2 diabetes), behavioral/mental health conditions (e.g., bipolar disorder, schizophrenia), systemic autoimmune diseases (e.g., systemic lupus erythematosus, rheumatoid arthritis), and neurodegenerative diseases (e.g., Alzheimer’s disease). Continuous traits, including height, bone mineral density, serum lipids, and C-reactive protein, also show the same pattern. These findings have several obvious implications: (1) the burden of disease posed by each of these loci will vary considerably among populations, with obvious public health implications that will differ between populations; (2) findings from GWAS in European ancestry groups may not be directly replicable or transferable to other populations; therefore, replication studies that aim to test for genetic variants identified in one population may not be possible in other populations because the risk allele is very rare or absent. Empirical evidence that supports this notion has started to emerge for type 2 diabetes, for which 2 GWAS in East Asian populations recently identified a signal in the KCNQ1 gene [2]. This signal had been missed in all the previous European-descent GWAS studies because the risk allele was far less frequent in European descent populations, thereby greatly reducing the power to detect the association [2]. These observations provide compelling reasons for ensuring that more human populations sampled from widely contrasting geographical locations around the world are included in the international effort to use genomic tools to gain novel insight into the pathophysiology of common human diseases.
Nearly all the diseases and traits considered in the present study show considerable ethnic and/or population differences in prevalence and incidence rates between the source populations represented by the HapMap 3 dataset. For example, on a global level, comprehensive reviews have shown that rheumatoid arthritis [3], schizophrenia [4], and type 1 diabetes [5] have been shown to differ markedly between countries (the latter by up to 350-fold) [5]. Similarly, in the United States, African Americans, Mexican Americans, and non-Hispanic White Americans (represented in the HapMap by ASW, MEX, and CEU, respectively) differ considerably in rates of obesity, type 2 diabetes, hypertension, dyslipidemia, and coronary artery disease [6]. While many of these differences can be attributed to environmental, lifestyle, and behavioral characteristics, it is nonetheless important to identify the genetic contribution to these differences. A survey of the relative frequencies of potential disease risk variants is a first step towards achieving this goal. The findings of the present study provide a compelling summary of such differences and highlight the need to expand current GWAS and follow-up studies to multiple populations.
Background population differentiation across continental populations for loci across the genome is well documented for the original HapMap populations [7,8] and usually exceeds the finer grained differentiation within continents, as was demonstrated by Heath et al. [8 ]in their study of the fine structure of European populations. This is consistent with the finding in this study of greater correlation or similarity within-continental groups compared to between-continental groups for these disease and trait loci identified from GWAS. Therefore, the findings of this study of loci of clinical and/or public health significance are broadly similar to those from genome wide studies of unselected loci.
The question of how often genetic or environmental variants produce unequal effects in different populations is often posed in the context of explaining health disparities and deciding if population-specific interventions are warranted for specific health conditions. Thus, the emphasis had been on ‘ethnicity-specific disease risk’ or the consistency of genetic effects across different racial or ethnic groups [9,10]. The largest systematic effort to investigate this question, a meta-analysis of 43 gene-disease associations [11], found that genetic effects are largely consistent across ethnic groups. A more recent study [12] investigated risk allele frequencies and population differentiation among 53 world populations in 25 SNPs which showed robust association with 6 complex diseases (from the Wellcome Trust Case Control Consortium study) and found that risk allele frequencies showed substantial variation across the populations, including some that were fixed or absent in a population. In the present study, we present systematic evidence showing that allele frequencies at risk loci for common complex diseases discovered from GWAS differ substantially between global population groups. This implies that, assuming similar effect sizes for a locus across populations, the population attributable risk (PAR) for any given associated allele would vary considerably across populations simply as a function of the frequency of that allele (apart from other genetic and/or environmental factors). This will be true for single gene effects but may also have immense implications for gene-gene and gene-environment interactions in which the frequency (or rarity) of a specific risk variant may significantly modify disease risk from the interaction.
Conclusions
Our understanding of the relative contributions of identified genetic variants and environmental factors to disparities in disease prevalence would be enhanced when more studies are completed in multiple populations with ancestries from different parts of the world. Most discoveries from GWAS are not of SNPs with known functional significance and, in fact, most are not even in coding regions as shown in table 2. This suggests that these SNPs are likely tags for the functional variants. The well-known differences in LD (linkage disequilibrium) patterns between populations suggest that these differences in allele frequencies are likely to also be observed in functional SNPs. There is suggestive evidence of this across the genome in the 4 original HapMap groups (although this was not statistically significant) [7], as well as in SNPs in candidate genes for cardiovascular disease [13]. Wide inter-population variation in allele frequencies for any single reported signal (in addition to the well-known differences in local LD patterns) implies that multiple variants around the primary reported signals be genotyped when attempting to replicate GWAS findings in multiple global populations. This approach would not only take into account population-specific LD patterns when attempting to confirm and replicate known association signals, it would also extend the applicability of such findings and increase the likelihood of finding the functional variants involved in the etiology of the disease [14,15].
For several reasons, including longer life expectancy and varying successes in overcoming the ravages of communicable diseases, common complex diseases have truly become a global public health problem in the 21st century. In this regard, it is critically important that we design studies that can take full advantage of the unfortunately growing global health problem of non-communicable diseases. This approach should increase our understanding of the contribution of genetic variants to the increasing global burden of common human diseases in specific populations. This is especially important as we try to place the role of genetics alongside traditional epidemiologic risk factors within the context of the historic and cultural experiences of human populations.
Acknowledgements
This research was supported by the Intramural Research Program of the NIH, National Human Genome Research Institute. AA and CR conceived and designed the study. AA conducted the data acquisition and analysis. Both authors did the interpretation of the data, drafting and approval of the manuscript.
