

Abstract
Cranial suture development involves coordinated expression of multiple genes and tissue contribution from neural crest cells and paraxial mesoderm for timely sutural morphogenesis. Transcription factors, growth factors, and neural crest determinant genes play critical roles in calvarial growth ensuring normal development of the underlying brain. In vitro studies have implicated cell-cell adhesion molecules as a driving force behind suture closure. We performed cDNA microarray to study differential expression of adhesion molecules during the timing of suture closure in a mouse model where only the posterior frontal (PF) suture closes. Our results indicate increased expression of E-cadherin during the period of PF suture closure. Quantitative RT-PCR analysis of E- and N-cadherin in PF closing suture revealed a biphasic expression of N-cadherin, the first phase coinciding with cellular condensation preceding chondrogenesis followed by a second phase coinciding with E-cadherin co-expression and suture closure. Furthermore, expression analysis of the N-cadherin and E-cadherin transcriptional repressors Wnt7a and Snail indicate a specific temporal regulation of these genes, suggesting their potential role as regulators of both E- and N-cadherin during the PF suture development and closure. Finally, given the in vitro evidence of fibroblast growth factor (FGF)-2 as a potential regulator of E- and N-cadherin we investigated the expression of E-cadherin during PF suture closure in Fgf-2 deficient mice. In contrast to in vitrodata previously reported, E-cadherin expression is normal in these animals, and PF suture closure occurs properly, probably due to potential redundancy of FGF ligands ensuring normal temporal expression of E-cadherin and PF suture closure.
Introduction
Cranial suture development is a complex process involving controlled regulation of multiple genes. Several genes, including transcription factors, growth factors, and their cognate receptors are implicated in this process [Wilkie, 1997; Opperman, 2000; Rice et al., 2003]. Dysregulation at any control level would potentially lead to premature suture fusion or craniosynostosis [Wilkie, 1997]. Mutations in several genes have been implicated in pathologic development of cranial sutures, including fibroblast growth factor receptors (FGFRs), transcription factors MSX2 and TWIST, and fibrillin-1 (FBN1) [Bellus et al., 1996; Howard et al., 1997; Meyers et al., 1996; Muenke et al., 1994; Sood et al., 1996]. All of the above genes have been linked to osteoblast differentiation biology. How exactly mutations in these genes cause premature fusion of calvarial sutures has been a subject of intense study in the past decade. The overall picture of suture biology at the molecular level has become clearer in recent years using candidate gene approaches and microarray technology on cell cultures, organ cultures and in vivo sutures. Although growth and transcription factors have been clearly implicated in normal suture development, their downstream structural protein targets have not received much attention in this context.
The posterior frontal (PF) suture is of neural crest origin [Jiang et al., 2002], and is the only cranial suture which in mice closes during the second week of life [Sahar et al., 2005], while all other cranial sutures remain patent throughout life. The PF suture is endowed with a sophisticated architecture comprised of 2 layers of bone: the ectocranial and endocranial layer [Sahar et al., 2005]. We have previously demonstrated that the endocranial layer of PF suture closes through an endochondral ossification process, and Sox9 gene is a key regulator in this process [Sahar et al., 2005].
Given the sophisticated PF suture architecture and previous in vitro studies demonstrating the importance of cell-cell adhesion molecules in chondrogenesis and osteogenesis, we hypothesized that the PF closure would involve cell-cell adhesion molecules. In our initial search for candidate genes of structural proteins involved in suture patterning and closing, we performed a comparative cDNA microarray analysis between mouse PF and sagittal (SAG) calvarial sutures to investigate differential gene expression in closing versus patent sutures, respectively. Our results indicated that among the genes encoding for cell-cell adhesion molecules that were differentially up-regulated in closing sutures, E-cadherin is one of the most prominent.
Cadherins are calcium dependent cell-cell adhesion molecules that give cells the ability to create form in aggregate [Yagi and Takeichi, 2000]. These adhesion molecules are involved in tissue differentiation and morphogenesis [Gumbiner, 1996; Vleminckx and Kemler, 1999]. Cell differentiation and tissue organization require a specific repertoire of cadherins that provide cues for cell specification and commitment to a certain lineage. The failure of E-cadherin null mice to form epithelia or a blastocyst cavity demonstrates its pivotal role in basic morphogenetic development [Larue et al., 1994]. Moreover, differential expression of cadherin family members is responsible for cell sorting, tissue differentiation and organogenesis during development [Yagi and Takeichi, 2000; Jamora et al., 2003]. In addition, it has been demonstrated that N-cadherin and OB-cadherin expression is important in osteoblast biology in vitro [Okazaki et al., 1994] and in vivo [Kawaguchi et al., 2001]. Classic cadherins are a potential effector downstream of the Fgf-2/Msx2 pathway. Both N- and E-cadherin are expressed in normal human calvarial pre-osteoblasts and osteoblasts [Lemonnier et al., 1998]. Studies in cells harboring FGFR-2 S252W gain-of-function mutation, a cause of syndromic form of craniosynostosis in humans, have shown increased cell aggregation and up-regulation of E-cadherin [Lemonnier et al., 2001].
Here we investigate the temporal-spatial expression of E-cadherin and N-cadherin during the first month of life in CD-1 mice. Our results demonstrated that E-cadherin and N-cadherin gene expression is tightly regulated during PF suture patterning and closure. Specifically, E-cadherin expression is up-regulated during the timing of PF suture closure, while the N-cadherin gene expression profile is biphasic, with a first up-regulation phase preceding chondrogenesis, followed by a second up-regulation phase coinciding with the period of PF suture closure, as well as E-cadherin co-expression. Furthermore, gene expression analysis of the N-cadherin and E-cadherin transcriptional repressors Wnt7a and Snail[Tufan and Tuan, 2001; Batlle et al., 2000; Cano et al., 2000; Hajra et al., 2002] indicate a specific temporal regulation of these genes, suggesting their potential role as regulators of both E- and N-cadherin in the context of PF suture development and closure.
Finally, given the in vitro evidence of FGF-2 as a potential regulator of E-cadherin, we analyzed E-cadherin expression in PF suture of Fgf-2 null mice. Our results demonstrate normal E-cadherin expression and lack of abnormal phenotype in PF suture of Fgf-2 deficient mice.
Materials and Methods
Animals
The animals were cared for in accordance with the guidelines of the institutional animal care and the use committee at Stanford University. CD-1 mice obtained from Charles River Laboratories (Wilmington, Mass., USA) were kept in a temperature- and moisture-controlled animal facility. Animals were sacrificed on a specific post-natal (p) day that was based on birth date (day 0). Time points included: p1, p3, p5, p6, p7, p8, p9, p10, p11, p12, p13, p14, p15, p16, p17 and p25. Mice heterozygous for the Fgf2tm1Doe targeted-mutant allele were obtained from Jackson Laboratories (www.jax.org). The mouse strain of Fgf-2 null is C57BL/6J. Homozygous mice were selected by Mendelian inheritance and genotyping was performed according to Jackson Laboratories’ protocol (stock number 003256).
Tissue Harvest
Mice were sacrificed by CO2 asphyxiation and the calvariae were dissected. PF and SAG sutures were meticulously harvested from CD-1 mice using Surgical Acuity™ loupes. After clearly identifying the lambdoidal, SAG, coronal, PF and anterior frontal sutures, the PF and SAG suture complexes inclusive of the suture mesenchyme, adjacent osteogenic fronts of the opposing calvarial growth plates, and the underlying dura mater were carefully dissected, separated and harvested using fine, slightly curved sharp tip scissors (www.finescience.com). Suture width after harvest measured 0.6–0.8 mm. The length of sutures depended on animal age. The bregma was excluded. The sutures were snap frozen for RNA extraction and stored at –80°C.
Tissue RNA Extraction
One litter (on average 8 animals) of CD-1 mice or Fgf-2 null mice was used for each time point. Pooled sutures for each condition and time point were homogenized in 0.6 ml of Trizol (Invitrogen, Carlsbad, Calif., USA) using a Pellet Pestle Motor (Kontes). RNA was extracted and precipitated using chloroform and 2-propanol. RNA was further washed with DEPC treated 70% ethanol according to the manufacturer’s protocol.
Tissue Processing and Staining
Following sacrifice of animals described above, the calvariae were harvested and immediately fixed in fresh, chilled 4% paraformaldehyde overnight at 4°C followed by 24–48 h of decalcification in Formical-2000 (Decal Chemical Company, Congers, N.Y., USA). The calvaria was divided coronally through the bregma to separate the PF from the SAG sutures. The specimen then underwent dehydration in a graded ethanol series and were paraffin embedded. The entire blocks were serially sectioned (5–7 µm) totaling to approximately 400 sections for each block. Every other slide was stained with routine hematoxylin and eosin for evaluation and the remaining slides were used for immunohistochemistry. The stained sutures were examined with Carl Zeiss Axioplan 2 (Zeiss, Thornwood, N.Y., USA) microscope. Images were captured by AxioVision (Zeiss) and combined by Adobe Photoshop (Adobe Systems, San Jose, Calif., USA). Fusion was defined as mature bony bridge between the osteogenic fronts.
cDNA Arrays
We utilized Mus musculus cDNA large-scale microarrays manufactured by the Stanford Functional Genomics Facility (www.microarray.org). Prior to use, slides were rehydrated in a hydration chamber for 20 min at room temperature followed by snap drying at 7°C. The poly-L-lysine surface was blocked by treatment with 0.05% succinic anhydride prepared in a buffer solution consisting of 350 ml of 1-methyl-2-pyrrolidinone and 15 ml of boric acid for 20 min on a shaker. The cDNAs on the slides were then denatured in distilled water for 2 min at 95°C followed by fixation with 95% ethanol. Forty micrograms of RNA per time point from PF and SAG sutures were reverse transcribed to fluorescently-labeled cDNA probes for hybrization using Cy3-dUTP and Cy5-dUTP (Amersham, Piscataway, N.J., USA). Our common reference point was RNA extracted from calvariae at several time points. After probe hybridization, the arrays were incubated overnight at 65°C followed by serial washing in saline sodium citrate solution. Arrays were immediately scanned using a GenePix Scanner (Axon Instruments, Foster City, Calif., USA). The array images obtained were analyzed by GenePix Pro software (Axon Instruments) and imported to the Stanford Microarray Database for further comparison and interpretation. In addition, we utilized Significance Analysis of Microarrays for statistical analysis of arrays.
Quantitative Real-Time PCR
Purified and quantified RNA was treated with DNAse I (Ambion, Austin, Tex., USA) to clear genomic DNA. Five µg of total RNA from each time point was reverse transcribed to cDNA using random primer hexamers (Invitrogen). Primers were designed with Primer Express™ software (Applied Biosystems). Each primer was subjected to RT-PCR to ensure single primary amplicon as evidenced by 2% agarose gel electrophoresis to be between 100–150 bp. Primer sequences used: E-cadherin F: GCCAATCCTGATGAAATTGGAA; R: CAGAACCACTGCCCTCGTAATC, N-cadherin F: CCGTGAATGGGCAGATCACT; R: TAGGCGGGATTCCATTGTCA, Snail F: ACCCACTCGGATGTGAAGAGA; R: GGAAGATGCCAGCGAGGAT, Wnt7a F: CCGTTGGAACTGCTCAGCG; R: CCGCAGCGATAATCGCATAG.
Amplified fragments were ligated into pGEM Easy Vector (Promega, Madison, Wisc., USA) and sequence was confirmed using DNA sequence analysis (Stanford Genome Technology Center, Stanford, Calif., USA). Samples along with primers and Syber Green Master Mix (Applied Biosystems) were loaded in a 384-well sealed plate and the reaction was run in ABI Prism 7900 HT (Applied Biosystems) according to the manufacturer’s protocol. Gapdh(Applied Biosystems) was used for internal control. The standard curve method of quantitation was used to calculate expression of target genes relative to the housekeeping gene Gapdh. Four serial dilutions of cDNA (1:4) were made for the calibration curve and trend lines were drawn using Ct values versus log of dilutions for each target gene and Gapdh run in triplicate with correlation coefficient (R2 > 0.99). Relative expressions were calculated using line equations derived from calibration curves and obtaining ratios of target gene to Gapdh for each time point. For each gene, experiments were run at least 3 times using 3 independent litters of mice. The error bars reflect variability between litters.
Statistical Analysis
The results are presented as the mean ± SE of 3 independent experiments. Statistical differences between the means are examined by Student’s test or 1-way ANOVA between groups with Tukey’s multiple comparison test on Prism software (Prism version 3.0 for Windows; GraphPad, San Diego, Calif., USA). A p value <0.05 was considered statistically significant.
Immunohistochemistry
Selected paraffin embedded sections were chosen and heat antigen retrieval was performed. Vectastain ABC system (Vector Laboratories, Burlingame, Calif., USA) was used according to the manufacturer’s protocol. Primary antibody against E-cadherin (H-108) and N-cadherin (H-63; Santa Cruz Biotechnology, Santa Cruz, Calif., USA), were used in 1:50 to 1:500 dilutions. Biotinylated secondary antibody was used in 1:200 dilutions. Controls for each primary antibody consisted of probing with normal (irrelevant) rabbit IgG (sc-2027; Santa Cruz Biotechnology), followed by incubation with biotinylated secondary antibody. Immunostaining with the irrelevant IgG did not detect any staining (data not shown).
Results
cDNA Microarray Analysis of PF and SAG Suture on p5 and p15
To search for candidate cell-cell adhesion molecules differentially expressed in PF suture during its closure, we performed cDNA microarray on PF and SAG sutures on days p5 and p15, before and after the period of suture closure. Our results revealed up-regulation (approximately 9-fold) of E-cadherin gene expression in the PF suture at day p15 compared to p5 (fig. 1a). In contrast, the expression of E-cadherin remained steady in SAG suture during the same time points. In order to validate the data obtained from microarray analysis, we performed quantitative real-time PCR (qRT-PCR). As shown in figure 1b, qRT-PCR validates the microarray results. Thus, these results indicated that E-cadherin is differentially expressed in patent versus closed PF suture.

Differential E-cadherin expression in cranial sutures. a Microarray profile of E-cadherin gene on SAG and PF suture shows that the gene is up-regulated exclusively in the PF suture at p15. Green = Lower than mean expression; red = higher than mean expression. b Quantitative real-time RT-PCR confirmed the up-regulation of E-cadherin gene expression in PF suture at p15. Quantified mRNA values were normalized by the amounts of Gapdh mRNA, and results are given as fold induction. The results are presented as the mean ± SD of 3 independent experiments.
Differential E-cadherin expression in cranial sutures. a Microarray profile of E-cadherin gene on SAG and PF suture shows that the gene is up-regulated exclusively in the PF suture at p15. Green = Lower than mean expression; red = higher than mean expression. b Quantitative real-time RT-PCR confirmed the up-regulation of E-cadherin gene expression in PF suture at p15. Quantified mRNA values were normalized by the amounts of Gapdh mRNA, and results are given as fold induction. The results are presented as the mean ± SD of 3 independent experiments.
E-cadherin Expression Pattern during PF Suture Development and Closure
Next, to investigate the potential relationship between E-cadherin expression and PF suture biology, we analyzed the expression of this gene during the first month of life in the PF suture, using qRT-PCR. As shown in figure 2a, an increase in E-cadherin expression is noted as early as day p9. Maximal expression is observed on day p15 with down-regulation by day p17. This period coincides with the period of PF suture closure, which starts around p10 and mostly completes by p15 [Sahar et al., 2005]. To define the precise spatial localization of E-cadherin protein we performed immunohistochemistry on PF suture sections obtained from different time points from the beginning to the end of suture closure time. As shown in figure 2b, immunohistochemical analysis performed using an E-cadherin-specific antibody detected at days p5 and p7 E-cadherin positive cells mainly at the osteogenic front, in the pericranium and dura mater, while very few positive cells were present in the suture mesenchyme. At day p9 some chondrocytes and pre-hypertrophic chondrocytes present in the suture mesenchyme stain positively. More positive E-cadherins cells were observed in the differentiating suture mesenchyme at days p9 and p11. Finally, at day p15 a strong E-cadherin staining was observed in the ossified endocranial layer of PF suture, overlying pericranium and underlying dura mater. In addition, immunostaining was also observed in the area of suture populated by red blood cells, vessels and lymphocytes. Thus, the immunohistological data confirm the gene expression profile. Moreover, the expression profile of the E-cadherin gene on SAG suture during the first month of life did not reveal any specific up-regulation of this gene compared to that observed in PF suture (fig. 2c).

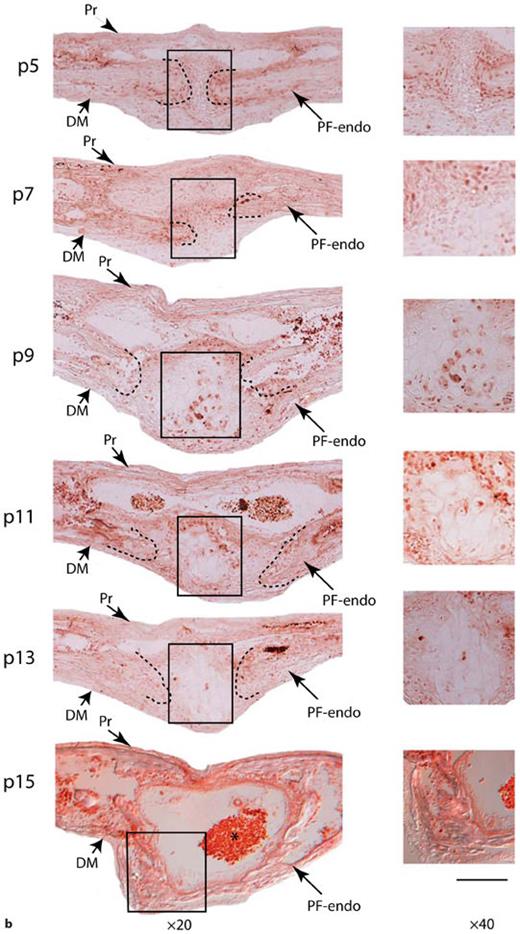
E-cadherin expression in posterior frontal suture during the first month of life. a Quantitative real-time PCR for E-cadherin on PF suture reveals up-regulation of E-cadherin gene starting at day p9 with maximal expression at days p13–p15, a period coinciding with active bone deposition in the PF suture and suture closure. Quantified mRNA values were normalized by the amounts of Gapdh mRNA, and results are given as fold induction. The results are presented as the mean ± SD of 3 independent experiments from 3 independent litters. * p < 0.05. b Immunohistochemistry analysis of E-cadherin protein performed using a specific E-cadherin antibody, shows at day p5 absence of positive cells in the suture mesenchyme PF suture (boxed area), while positive cells are detected in the surrounding osteogenic fronts. At day p7, a faint E-cadherin staining of few cells is observed, E-cadherin staining is also detected in pericranium and dura mater cells. Starting from day p9, more E-cadherin positive cells are detected in differentiating mesenchyme of the endocranial layer of PF suture. At day p15 an intense E-cadherin staining is observed in the bony bridge of closed endocranial layer of PF suture (boxed area). Boxed areas corresponding to the suture mesenchyme undergoing to endochondral ossification are magnified in panels on the right column. Dashed lines mark the osteogenic front of approaching bone plates Note, immunostaining is also observed in the area of suture populated by red blood cells, vessels and lymphocytes (asterisk). Pr = Pericranium; DM = dura mater; PF- endo = PF endocranial suture. Scale bar: 200 µm (at ×20) and 50 µm (at ×40).c Quantitative real-time PCR for E-cadherin performed on SAG suture and its comparison with expression profile observed in PF suture. Expression of E-cadherin gene in SAG suture remains steady during the first month of life. The results are presented as the mean ± SD of 3 independent experiments from 3 independent litters.
E-cadherin expression in posterior frontal suture during the first month of life. a Quantitative real-time PCR for E-cadherin on PF suture reveals up-regulation of E-cadherin gene starting at day p9 with maximal expression at days p13–p15, a period coinciding with active bone deposition in the PF suture and suture closure. Quantified mRNA values were normalized by the amounts of Gapdh mRNA, and results are given as fold induction. The results are presented as the mean ± SD of 3 independent experiments from 3 independent litters. * p < 0.05. b Immunohistochemistry analysis of E-cadherin protein performed using a specific E-cadherin antibody, shows at day p5 absence of positive cells in the suture mesenchyme PF suture (boxed area), while positive cells are detected in the surrounding osteogenic fronts. At day p7, a faint E-cadherin staining of few cells is observed, E-cadherin staining is also detected in pericranium and dura mater cells. Starting from day p9, more E-cadherin positive cells are detected in differentiating mesenchyme of the endocranial layer of PF suture. At day p15 an intense E-cadherin staining is observed in the bony bridge of closed endocranial layer of PF suture (boxed area). Boxed areas corresponding to the suture mesenchyme undergoing to endochondral ossification are magnified in panels on the right column. Dashed lines mark the osteogenic front of approaching bone plates Note, immunostaining is also observed in the area of suture populated by red blood cells, vessels and lymphocytes (asterisk). Pr = Pericranium; DM = dura mater; PF- endo = PF endocranial suture. Scale bar: 200 µm (at ×20) and 50 µm (at ×40).c Quantitative real-time PCR for E-cadherin performed on SAG suture and its comparison with expression profile observed in PF suture. Expression of E-cadherin gene in SAG suture remains steady during the first month of life. The results are presented as the mean ± SD of 3 independent experiments from 3 independent litters.
The tightly regulated expression of the E-cadherin gene suggests a potential role of this cell-cell adhesion molecule in PF suture closure.
Biphasic Expression Pattern of N-cadherin during PF Suture Development and Closure
PF suture closure occurs by endochondral ossification of endocranial layer [Sahar et al., 2005]. Given the role of N-cadherin in mesenchymal condensation and osteoblast differentiation [Oberlender and Tuan, 1994; Ferrari et al., 2000; DeLise and Tuan, 2002; Tuan, 2003; Tuli et al., 2003; Kii et al., 2004; Stains et al., 2005], we performed qRT-PCR to examine the expression pattern of N-cadherin during PF suture closure (fig. 3a, top panel). Interestingly, the profile of N-cadherin appeared biphasic. The first peak expression was observed on day p7, a period when mesenchymal cell condensation is noted in the endocranial plate of the PF suture [Sahar et al., 2005]. While, the second peak was detected at days p13–p15, a period marked by osteogenesis and closure of PF suture [Sahar et al., 2005], as well as by up-regulation of E-cadherin expression (fig. 2a, b). Of interest, the expression profile of the N-cadherin gene on SAG suture during the first month of life did not reveal any specific up- and/or down-regulation of this gene, its expression profile was steady (fig. 3a, bottom panel). The expression of N-cadherin gene in PF suture was further confirmed by immunostaining performed with specific N-cadherin antibody (fig. 3b). At days p5 and p7, N-cadherin immunostaining was detected in cells present in the suture mesenchyme of the endocranial layer of PF suture, as well as at osteogenic fronts and in the pericranium. By day p9 very faint staining was observed in the PF suture, only the few chondroblasts present in the suture mesenchyme stained positively, while chondrocytes were negative. At day p11 N-cadherin positive cells were completely absent in the differentiating suture mesenchyme. N-cadherin protein was detected later in the endocranial layer of PF suture, at p13 and p15 when the PF suture closes. Immunohistochemistry performed with irrelevant IgG did not detect any staining (data not shown). Thus, immunohistochemistry analysis mirrored the gene expression profile. The peculiar expression pattern may reflect a dual role for N-cadherin during PF suture closure: during cellular condensation preceding PF suture chondrogenesis, and later during osteogenesis when the PF suture closes.
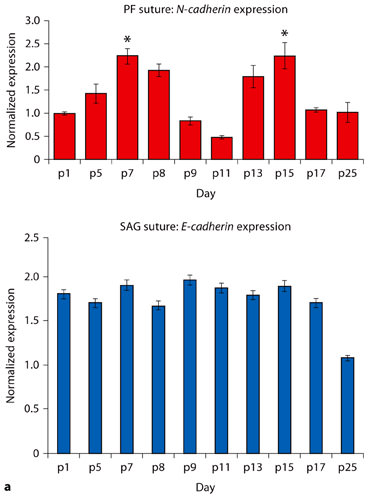

aN-cadherin expression in the posterior frontal suture during the first month of life. Top panel: Quantitative real-time PCR for N-cadherin on PF suture reveals a biphasic expression profile of N-cadherin gene. N-cadherin is first up-regulated on p7, a period coinciding with a cellular condensation in the endocranial plate of the PF suture. A second phase of N-cadherin gene up-regulation is observed on p13–p15, a period marked by osteogenesis and closure of PF suture. Bottom panel: Quantitative real-time PCR for E-cadherin on SAG suture shows that the expression is steady overtime. Quantified mRNA values were normalized by the amounts of Gapdh mRNA, and results are given as fold induction. The results are presented as the mean ± SD of 3 independent experiments from 3 independent litters. * p < 0.05. b Immunolocalization of N-cadherin protein on PF suture using a specific anti-N-cadherin antibody mirrors the biphasic gene expression profile and localizes N-cadherin protein in the suture mesenchyme of the endocranial layer of PF suture during cellular precondensation at day p5 and p7. By day p9 only a few condroblasts present in the differentiating suture mesenchyme stain positively. At day p11 none of the cells present in the suture stain positive. In contrast, by day p13 a strong N-cadherin staining is observed in the endocranial layer of PF suture. Day p15, which marks the closure of PF suture, is also characterized by strong N-cadherin staining in the area of endochondral ossification (boxed area). Pericranium, osteoblasts and dura mater, also stain positively for N-cadherin. Boxed areas are magnified in panels on the right column. Pr = pericranium; DM = dura mater; PF-endo = PF endocranial suture. Scale bar: 200 µm (at ×20), 50 µm (at ×40).
aN-cadherin expression in the posterior frontal suture during the first month of life. Top panel: Quantitative real-time PCR for N-cadherin on PF suture reveals a biphasic expression profile of N-cadherin gene. N-cadherin is first up-regulated on p7, a period coinciding with a cellular condensation in the endocranial plate of the PF suture. A second phase of N-cadherin gene up-regulation is observed on p13–p15, a period marked by osteogenesis and closure of PF suture. Bottom panel: Quantitative real-time PCR for E-cadherin on SAG suture shows that the expression is steady overtime. Quantified mRNA values were normalized by the amounts of Gapdh mRNA, and results are given as fold induction. The results are presented as the mean ± SD of 3 independent experiments from 3 independent litters. * p < 0.05. b Immunolocalization of N-cadherin protein on PF suture using a specific anti-N-cadherin antibody mirrors the biphasic gene expression profile and localizes N-cadherin protein in the suture mesenchyme of the endocranial layer of PF suture during cellular precondensation at day p5 and p7. By day p9 only a few condroblasts present in the differentiating suture mesenchyme stain positively. At day p11 none of the cells present in the suture stain positive. In contrast, by day p13 a strong N-cadherin staining is observed in the endocranial layer of PF suture. Day p15, which marks the closure of PF suture, is also characterized by strong N-cadherin staining in the area of endochondral ossification (boxed area). Pericranium, osteoblasts and dura mater, also stain positively for N-cadherin. Boxed areas are magnified in panels on the right column. Pr = pericranium; DM = dura mater; PF-endo = PF endocranial suture. Scale bar: 200 µm (at ×20), 50 µm (at ×40).
Expression of N- and E-cadherin Transcriptional Repressors Wnt7a and Snail
Temporally and spatially localized expression of N- and E-cadherin in the PF suture during the period of suture closure suggests strict regulation of these 2 molecules. Previous in vitro studies have shown pre-chondrogenesis condensation events preceding overt chondrogenesis to be associated with Wnt7a-mediated N-cadherin regulation [Tufan and Tuan, 2001; Tufan et al., 2002; Tuli et al., 2003]. Particularly, it has been demonstrated that Wnt7a mis-expression negatively affects N-cadherin expression during limb mesenchymal chondrogenesis [Tufan and Tuan, 2001]. Given the unique and tight expression pattern of N- and E-cadherin during the first month of life, we investigated the expression pattern of their transcriptional regulators Wnt7a and Snail, during the same period. Interestingly, Wnt7a was up-regulated in the PF suture during pre-chondrogenesis, as well as during chondrogenesis (p7–p11) and its expression returned to baseline during the period of osteogenesis (p13–p15). More important, the maximal up-regulation of Wnt7a coincided with the maximal down-regulation of N-cadherin. (fig. 4a, b) This pattern of expression would suggest that Wnt7a is a potential mediator of N-cadherin expression in PF suture and thus, cellular condensation, is a prerequisite to differentiation along the chondrogenic pathway.
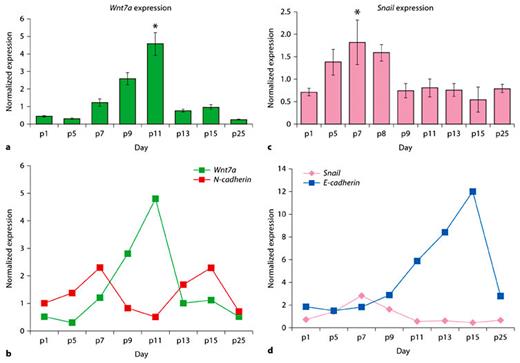
Expression of N- and E-cadherin transcriptional repressors Wnt7a and Snail.a Quantitative real-time PCR for Wnt7a on PF suture reveals up-regulation of Wnt7a geneas early as p7, with maximal expression on p11 and return to baseline by p13. b The inverse gene expression correlation between Wnt7a and N-cadherin. Note that Wnt7a gene expression is specifically up-regulated during the down-regulation of N-cadherin gene. c Quantitative real-time PCR for Snail on PF suture reveals a moderate up-regulation of Snail genestarting on p5, with a decrease on p9 and a return to baseline by p15. * p < 0.01). d Graph showing the inverse gene expression profile of Snail and E-cadherin during the PF suture patterning and closure. Quantified mRNA values were normalized by the amounts of Gapdh mRNA, and results are given as fold induction. The results are presented as the mean ± SD of 3 independent experiments. * p < 0.05.
Expression of N- and E-cadherin transcriptional repressors Wnt7a and Snail.a Quantitative real-time PCR for Wnt7a on PF suture reveals up-regulation of Wnt7a geneas early as p7, with maximal expression on p11 and return to baseline by p13. b The inverse gene expression correlation between Wnt7a and N-cadherin. Note that Wnt7a gene expression is specifically up-regulated during the down-regulation of N-cadherin gene. c Quantitative real-time PCR for Snail on PF suture reveals a moderate up-regulation of Snail genestarting on p5, with a decrease on p9 and a return to baseline by p15. * p < 0.01). d Graph showing the inverse gene expression profile of Snail and E-cadherin during the PF suture patterning and closure. Quantified mRNA values were normalized by the amounts of Gapdh mRNA, and results are given as fold induction. The results are presented as the mean ± SD of 3 independent experiments. * p < 0.05.
Similarly, an important transcriptional repressor of E-cadherin is the transcription factor Snail [Batlle et al., 2000; Cano et al., 2000]. Given the highly regulated expression of E-cadherin during the period of PF suture patterning and closure, we analyzed the expression of Snail during the first month of life. As shown in figure 4c, an up-regulated expression of Snail was noted only during the period of pre-chondrogenesis (p5–p8), marking the mesenchymal condensation period. Snail expression returned to a basal level during suture closure and osteogenesis, a period marked by up-regulation of E-cadherin(fig. 4d). The above expression patterns suggest that Wnt7a and Snail may be potential regulators of E- and N-cadherin expression during the PF suture patterning and closure.
E-cadherin Expression Pattern in Fgf-2 Knockout Mice
Several studies have demonstrated that in vitro FGF-2 induces expression of E-cadherin[El-Hariry et al., 2001; Debiais et al., 2001; Strutz et al., 2002; Marie et al., 2002]. Furthermore, the activating FGFR-2 mutation also causes up-regulation of E-cadherin expression in vitro[Lemonnier et al., 1998]. We have previously showed that Fgf-2 is up-regulated during PF suture development and closure. Specifically, the expression of Fgf-2 increases at day p9 [Sahar et al., 2005]. Thus, up-regulation of Fgf-2 expression followed by up-regulation of both, E- and N-cadherin, may suggest a causal role. Therefore, this observation prompted us to analyze the expression pattern of E-cadherin in PF suture of Fgf-2 null mice. qRT-PCR analysis indicated that E-cadherin expression is not down-regulated in PF suture of Fgf-2 null mice (fig. 5a), as would be predicted based on previous in vitrodata. Indeed, E-cadherin expression is similar to that observed in wild-type animals (fig.2a). A possible explanation for the apparent contradiction between these in vivodata and in vitrodata previously reported could be the redundancy of FGF ligands in the PF suture context. For instance, FGF-18, which is also expressed in the PF suture [Sahar et al., 2005] may compensate for the lack of FGF-2 ligand.

E-cadherin expression is not down-regulated in the PF suture of Fgf-2 null mice. aE-cadherin expression in PF suture of Fgf-2 null mice during the first month of life was assessed by quantitative real-time PCR. Up-regulation of E-cadherin gene is observed starting on p5 with maximal level on p9 and return to baseline by p11. Note that up-regulation of E-cadherin gene in Fgf-2 null mice occurs earlier than in CD-1 wild-type mice. bN-cadherin expression in PF suture of Fgf-2 null mice also shows a pattern similar to that of wild-type CD-1 mice. Quantified mRNA values were normalized by the amounts of Gapdh mRNA, and results are given as fold induction. The results are presented as the mean ± SD of 3 independent experiments. * p < 0.05.
E-cadherin expression is not down-regulated in the PF suture of Fgf-2 null mice. aE-cadherin expression in PF suture of Fgf-2 null mice during the first month of life was assessed by quantitative real-time PCR. Up-regulation of E-cadherin gene is observed starting on p5 with maximal level on p9 and return to baseline by p11. Note that up-regulation of E-cadherin gene in Fgf-2 null mice occurs earlier than in CD-1 wild-type mice. bN-cadherin expression in PF suture of Fgf-2 null mice also shows a pattern similar to that of wild-type CD-1 mice. Quantified mRNA values were normalized by the amounts of Gapdh mRNA, and results are given as fold induction. The results are presented as the mean ± SD of 3 independent experiments. * p < 0.05.
Interestingly, in Fgf-2 null mice the up-regulation of E-cadherin expression occurs earlier than in wild-type mice (fig.2a). The trend of this expression profile has been consistently observed at least in three independent experiments. However, we cannot rule out that the earlier up-regulation of E-cadherin expression observed in the PF suture of Fgf-2 null mice is merely due to the different genetic background existing between wild-type and Fgf-2 null mice. Finally, histological analysis of PF suture did not show abnormal phenotype, but closure occurred approximately 2 days earlier than in CD-1 mice (data not shown). Furthermore, analysis of N-cadherin did not reveal any differences in the expression pattern between Fgf-2 null and wild-type CD-1 mice (fig. 5b).
Discussion
The anatomy of PF suture is characterized by a complex architecture, and the molecular control of PF suture closure is a highly coordinated process characterized by a unique endochondral ossification of the endocranial layer [Sahar et al., 2005]. Sox9, the master regulator of chondrogenesis, is one of the genes controlling this process. To get more insights into the molecular mechanism controlling the PF suture we have performed a cDNA microarray analysis on mouse PF and SAG calvarial sutures from time points before and after closure to investigate differential gene expression in closing and patent sutures. The expression study reported here provides a basis for future functional studies with the aim to identify other genes controlling PF suture closure.
Adhesive interactions are essential not only in embryonic development, but also in a variety of other biological processes, including the differentiation and maintenance of tissue architecture. Cell-cell adhesion plays a critical role in the organization of cells to tissues during embryogenesis as well as adult life. Cadherins are a family of cell surface glycoproteins that function in promoting Ca2+-dependent cell-cell adhesion and serve as the transmembrane components of adherens junctions. The cadherins are a major class of membrane proteins with prominent roles in cell adhesion, and the regulation of tissue organization and morphogenesis.
Our interest focuses on cell-cell adhesion molecules N-Cadherin and E-cadherin since these molecules are regulators of chondrogenesis and osteogenesis, the 2 major events controlling the PF suture patterning and closure.
In order to differentiate along the chondrogenic pathway mesenchymal cells tightly gather together, a process known as mesenchymal condensation. This process results from active cell movement that causes an increase in mesenchymal cell packing density. N-cadherin is one of the cell-adhesion molecules implicated in this process. The unique biphasic expression pattern of N-cadherin in PF suture supports a potential role of this cell-cell adhesion molecule during PF patterning and closure. Our data indicate that N-cadherin expression is temporally up-regulated during the time coinciding with the mesenchymal condensation, while a dramatic down-regulation is observed during the period of chondrogenesis followed by a second up-regulation at the end of chondrogenic differentiation when endochondral ossification and, therefore, closure of PF suture has occurred. These data strongly suggest that N-cadherin may be involved in early events of PF suture patterning and closure, such as mesenchymal condensation preceding cartilage formation, and later during osteogenesis when the final step of PF suture occurs, while E-cadherin is mainly involved during the late steps of PF suture closure when the bony tissue replaces the cartilage (fig. 6). Our hypothesis is strongly supported by previous studies. Evidence indicating the involvement of N-cadherin mediated cell-cell adhesion in cellular condensation and chondrogenesis comes from studies designed to perturb N-cadherin function. A previous study demonstrated a substantial inhibition of cellular condensation and chondrogenesis both in vivo and in vitro using a function-blocking monoclonal antibody directed against N-cadherin [Oberlender and Tuan, 1994]. Moreover, it has been demonstrated that functional N-cadherin is required in a temporally and quantitatively specific manner for normal cellular condensation and chondrogenesis to occur. Interestingly, chondrogenesis is also suppressed by over-expression of either wild-type or mutant forms of N-cadherins, suggesting that temporally inappropriate cell-adhesion activities are in fact inhibitory to chondrogenic differentiation, possibly because of inappropriate timing of signaling events. In vitro work demonstrated that N-cadherin is required for mesenchymal cell specification in early phases of embryonic limb bud development, and perturbation of cadherin-mediated interactions disrupts chondrogenic cell condensation [Haas and Tuan, 1999; Tuan, 2003; Tuli et al., 2003]. However, persistence of N-cadherin expression prevents further progression from precartilage condensation to chondrocyte development, probably by stabilizing cell-cell adhesion [DeLise and Tuan, 2002].
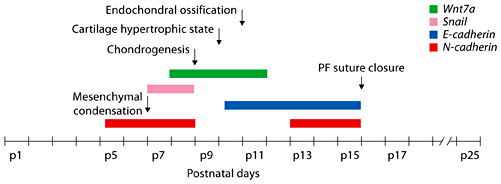
Temporal expression of N- and E- cadherins and their regulators, Wnt7a and Snail. The diagram summarizes the temporal gene expression profiles and the key differentiation events occurring during PF suture closing.
Temporal expression of N- and E- cadherins and their regulators, Wnt7a and Snail. The diagram summarizes the temporal gene expression profiles and the key differentiation events occurring during PF suture closing.
ThePF suture closure occurs through endochondral ossification, and interestingly our study reveals a peculiar expression pattern of N-cadherin during this process characterized by a biphasic up-regulation of this gene. A first up-regulation of N-cadherin gene expression is observed at early time points when mesenchymal condensation occurs (pre-chondrogenesis) followed by a second up-regulation at late time points when suture closure is completed.
It is known that N-cadherin down-regulation in precartilage condensation is a prerequisite step for mesenchymal cells to differentiate into chondrocytes. Therefore, the precise modulation of N-cadherin gene expression observed during the PF suture closure represents a crucial and permissive condition for the occurrence of suture closure. Indeed, our N-cadherin expression results are fully in agreement with previous observations.
Studies suggest that a cross-talk between N-cadherin and Wnt7a signaling occurs during the regulation of limb mesenchymal condensation. It has been demonstrated that misexpression of Wnt7a inhibits chondrogenesis in vitro, whereas Wnt5 a ligand activating the non-canonical Wnt signaling does not [Tufan and Tuan, 2001]. Moreover, Wnt7a mis-expression influences the expression and/or turnover of N-cadherin, thereby preventing it from being down-regulated at transition from condensation to chondrogenic differentiation. Interestingly, during PF suture closure we found a modulated expression of Wnt7 gene characterized by an up-regulation inversely correlating with that of N-cadherin. These results suggest that Wnt7a is a potential negative regulator of N-cadherin function during the chondrogenic differentiation occurring in the closing PF suture.
The late up-regulation of E-cadherin gene during the PF closure timing would suggest a potential role for this molecule during the final step, when osteogenesis takes place. Of interest, a previous study performed on OB-cadherin null mutant mice showed a reduced calcified area at the PF suture that caused a round-shaped calvaria with increasing animal age to 3 months [Kawaguchi et al., 2001]. Indeed, this observation strongly supports the potential role of cadherins in the patterning and closure of PF suture.
Several studies indicated that E-cadherin gene expression is regulated by Snail, a transcriptional repressor which by binding to 3 E-boxes present in the E-cadherin promoter represses its transcription [Batlle et al., 2000]. Our analysis revealed in the closing PF suture at early time points an up-regulation of Snail gene overlapping with the down-regulation of E-cadherin expression. In contrast, at late time points Snail expression was down-regulated concomitantly with the up-regulation of E-cadherin expression. These results would suggest that E-cadherin expression in PF closing suture might be under the control of the transcriptional repressor Snail.
It is noteworthy that cadherins, also can modulate the canonical Wnt signaling. N-cadherin and E-cadherin can interact directly with β-catenin and, thereby, may decrease Wnt signaling [Linask et al., 1997; Xu et al., 2002; Nelson and Nusse, 2004]. Moreover, a novel mechanism by which N-cadherin interacts with the Wnt co-receptor LRP5 and regulates canonical Wnt/β-catenin signaling in osteoblasts has been described [Hay et al., 2009].
Taken together, our results demonstrate that during the patterning and closure of the PF suture there is a precise and unique modulation of the 2 major adhesion molecules N- and E-cadherin. We believe that this modulation may represent timing of signaling events governing the patterning and closure of PF suture. Our current results and ongoing experiments would suggest that E- and N-cadherins may represent a potential control of canonical Wnt signaling in PF suture. Indeed, the expression study presented herein sets the stage for future investigations aimed to further elucidate the molecular signaling underlying the patterning and closure of PF suture.
Acknowledgments
This work was supported by NIH grants R01DE13194 and R01 DE14526, and a grant from the Oak Foundation to M.T.L.
