

Abstract
Objective: To develop an intraoperative method for margin status evaluation during breast conservation therapy (BCT) using an automated analysis of imprint cytology specimens. Study Design: Imprint cytology samples were prospectively taken from 47 patients undergoing either BCT or breast reduction surgery. Touch preparations from BCT patients were taken on cut sections through the tumor to generate positive margin controls. For breast reduction patients, slide imprints were taken at cuts through the center of excised tissue. Analysis results from the presented technique were compared against standard pathologic diagnosis. Slides were stained with cytokeratin and Hoechst, imaged with an automated fluorescent microscope, and analyzed with a fast algorithm to automate discrimination between epithelial cells and noncellular debris. Results: The accuracy of the automated analysis was 95% for identifying invasive cancers compared against final pathologic diagnosis. The overall sensitivity was 87% while specificity was 100% (no false positives). This is comparable to the best reported results from manual examination of intraoperative imprint cytology slides while reducing the need for direct input from a cytopathologist. Conclusion: This work demonstrates a proof of concept for developing a highly accurate and automated system for the intraoperative evaluation of margin status to guide surgical decisions and lower positive margin rates.
Introduction
Breast conservation therapy (BCT) or partial mastectomy has been proven to have equal survival efficacy compared to full mastectomy through multiple studies with more than 10 years of follow-up and is currently considered the standard of care [1,2,3,4]. Despite advances in preoperative imaging and tumor localization through ultrasound and MRI, positive margin rates in BCT continue to range from 25 to 50%; positive margins have negative consequences for patients, surgeons, and the healthcare system, requiring additional treatments to ensure disease-free outcomes [5,6]. Several studies have employed the use of intraoperative frozen section analysis to evaluate the need to excise additional tissue during surgery [7]. However, frozen section analysis is a difficult, time-consuming, and tissue-destructive procedure that can be impractical for the evaluation of an entire lumpectomy surface. Imprint cytology has been shown to have equal accuracy in detecting positive margins compared to frozen section analysis while completely preserving tissue for traditional permanent section analysis [8,9]. Intraoperative imprint cytology has been successfully used by skilled cytopathologists in large scale clinical studies to reduce positive margin rates [10,11,12]. However, screening by the cytopathologist can be time consuming and could prolong the surgical procedure. A previous related study by Cortes-Mateos et al. [13] used a semiautomated software-based image analysis of epithelial cell density across an entire slide to validate that the number of epithelial cells sampled by imprint cytology is a good metric for positive margins. The present study describes the first use of a fast, completely automated analysis technique including automated debris filtering and autofocusing (in contrast with the previous study) so that no immediate input is needed by a cytopathologist. Furthermore, in the present study, analysis of permanent sections of tissue local to the region sampled by imprint cytology significantly improved the measures of accuracy and the ability to validate the current technique.
Background
Digital pathology and computer-aided diagnosis (CAD) are rapidly growing fields in the medical industry. Several competing companies and research laboratories are developing technology and software application suites that allow researchers and pathologists to analyze, quantify, and diagnose digital image data collected from the numerous imaging modalities, including bright-field and fluorescence microscopy, MRI, ultrasound, and CT, among others. Most applications utilizing optical microscopy attempt to perform more accurate measurements of cellular features that pathologists typically employ in making a diagnosis. CAD combines multiple quantitative measurements taken from each individual cell and subsequently employs pattern recognition or machine learning algorithms to classify or grade cells. While mimicking standard pathological analyses, CAD can exceed human performance in quantitative measurements such as DNA content or the size of organelles within each cell [14,15,16,17]. The majority of CAD tools are powered by supervised classification algorithms which self-adapt to recognize the different classifications of tissue expected within a set of images. These algorithms are first supplied with a training set wherein each cell has been preclassified by a pathologist. Subsequently, algorithm performance is evaluated on an independent test set of images without any preclassified cells. Problems can arise from imaging or sample preparation artifacts that preclude automated analysis from measuring suitable differences between different classes of cells under investigation. With careful evaluation and interaction with experienced pathologists, these techniques are often quite successful [18,19,20,21,22,23].
However, practical use of supervised classification algorithms can be limited by the computational processing required to classify a large data set with a selected algorithm [24]. For most tissue section preparations, a bright-field stain such as hematoxylin and eosin (H&E) is used by pathologists to evaluate tissue architecture and cellular grade to make determinations of disease progression. Selecting the proper measurements to distinguish tissue grades and validating the training set for the problem at hand can require considerable skill and experience [25]. By comparison, performing a fast intraoperative margin status evaluation of a cancerous tumor requires a simple ‘yes-or-no’ classification; the exact stage of disease progression is less important than knowing if disease is present or absent at the surgical margin. As far as we know, there are no reports of CAD for intraoperative analysis of breast cancer surgical margins. For imprint cytology of breast surgical margins, CAD of individual cells is challenging since most of the cancer cells are present in 3-dimensional clusters with unclear boundaries between neighboring and overlapping cells.
In the present study of breast cancer surgical margins, the classes for this technique were reduced simply to cancer and noncancer. In addition, fluorescent imaging and stains were used since highly specific antibody-antigen binding accomplishes the majority of the task of identifying the desired cells in a sample and can detect the cancer cells present in 3-dimensional clusters. Nevertheless, immunofluorescent staining is not perfect and nonspecific binding, environmental debris, and sample preparation can all introduce fluorescent artifacts that would be recognized as cells in any algorithm using only an intensity threshold to classify recognized objects on a slide. For these reasons, a fast algorithm was developed based on simple statistical, correlational, and morphological parameters to distinguish true epithelial cells from other fluorescently labeled debris located on imprint cytology specimens.
Methods
Surgical Samples
Institutional Review Board approval from the University of California, San Diego, was obtained to study breast cancer and noncancer tissue from patients. All patients underwent their planned procedure for breast surgical treatment, and the specimens were removed and sent to the pathology laboratory for analysis. As controls, noncancer samples were acquired from 2 groups of patients: normal tissue was collected from patients undergoing breast reduction surgery, and prophylactic tissue was obtained from patients undergoing prophylactic mastectomy of a noncancerous breast. All surgeries were performed at the University of California San Diego Medical Center. Standard techniques for resection of breast tissue were employed including electric cauterization (Valley Labs, Boulder, Colo., USA). Fresh specimens were gently imprinted onto poly-L-lysine (PLL)-coated glass slides (Newcomer Supply, Middleton, Wisc., USA).
Touch Preparation for Breast Epithelial Cells
After excision, surgical specimens were grossed by a pathologist. The area with the highest probability of containing tumor cells was located by palpation or by an image-guided wire that was placed preoperatively. A cut through the tumor was made at this location to generate a ‘calibrated’ positive margin with an area with a high probability of containing tumor cells. As explained below, permanent or frozen section pathology was performed on suspicious tissue so to verify that cancer cells were present in the ‘calibrated’ positive margin. For larger tumors, tissue was flash frozen for later analysis and for smaller tumors, the area was specially inked for later identification. These calibrated margins represent the worst possible outcome: a slice directly through the tumor with no margin of healthy tissue. PLL-coated slides were touched on both halves of the exposed tissue in the cross-sectional cut in a process known as imprint cytology or touch prep. For the permanent section analysis of this same region of tissue, a planar sample of the tissue was sectioned from the tumor surface either for paraffin embedding in a cassette (for T1 tumors, 2 cm or less) or for frozen sectional analysis in a frozen tissue block (for T2 and T3 tumors, greater than 2 cm). In most cases, 4 imprint cytology slides were available for automated analysis. Two slides were taken directly from the tumor surface, and the retained tissue sample was sandwiched between 2 additional slides (fig. 1). For some small tumors, only 3 imprint cytology slides were taken due to the small amount of tumor available for study.
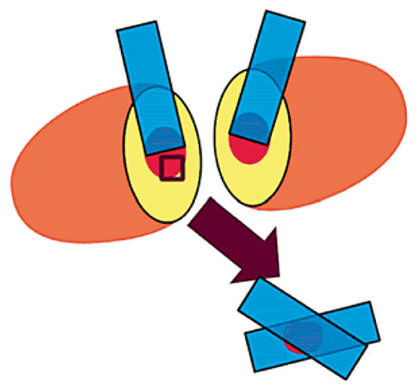
Cross-sectional slice at the suspected tumor location. Touch preps were taken from both sides of the cut, and a small tissue section from the tumor (red) was excised and saved in a cassette for further analysis (box). One or 2 touch preps were taken on the excised segment depending on the size of the tissue removed.
Cross-sectional slice at the suspected tumor location. Touch preps were taken from both sides of the cut, and a small tissue section from the tumor (red) was excised and saved in a cassette for further analysis (box). One or 2 touch preps were taken on the excised segment depending on the size of the tissue removed.
To ensure that the automated analysis and the standard pathological analysis were compared on the same location in the surgical specimen in all cases, localized pathological analysis was performed by a board-certified pathologist (J.W.R.) to confirm the presence or absence of cancer from the imprint cytology location. Several 5-micron-thick microtome sections (up to 12) were made through the tissue sample; to insure the most conservative data analysis, if the pathologist found cancer in any of the sections the entire tissue sample was declared positive. This local pathology was not performed in the previous study by Cortes-Mateos et al. [13]; therefore, the sensitivity was most likely underestimated.
Immunofluorescence Staining and Automated Microscopy
The immunofluorescent staining protocol was previously reported in detail and validated by Cortes-Mateos et al. [13]. Hoechst, a DNA stain, was used as a nuclei marker; cytokeratin was used as an epithelial cell marker. The complete staining protocol, which included fixation, permeabilization, and blocking, required 20–25 min. Others have found that immunofluorescence staining protocols can be reduced to only 10 min by decreasing the fixation time, skipping the blocking step, and decreasing the incubation time while maintaining image quality [26]. An automated scanning stage microscope was used for data acquisition (AxioImager Z1; Carl Zeiss, Inc., Thornwood, N.Y., USA). Automated control of the microscope was handled by a custom software application. The entire surface of each imprint cytology slide was imaged at a magnification of 5× using a 1.4-megapixel camera (Cool-SNAP HQ2; Photometrics, Pleasanton, Calif., USA); the imaging resolution was 1.267 µm/pixel. Two fluorescent images (1 for Hoechst fluorescence and 1 for cytokeratin fluorescence) were recorded at each image tile, and software autofocusing was employed to select the imaging plane [27,28].
Image Processing
Hoechst and cytokeratin images were employed to count the number of epithelial cells even when large clusters of epithelial cells were present. If all of the epithelial cells were single isolated cells, it would be easy to distinguish the epithelial cells from cytological debris (fragments of fat, necrosis, fibrin, and fragmented cytoplasmic material) based on the characteristic size and shape of epithelial cells. However, the epithelial cells from cancer cases are usually captured in large clusters. Therefore, in order for the cell counting to be effective, clusters of epithelial cells must be distinguished from cytological debris also present on the slide. The method of recognizing epithelial cells began with generating outlines for all fluorescing objects in a given cytokeratin image. The computed cytokeratin outlines were mapped to their corresponding Hoechst fluorescence image to obtain additional measurements (fig. 2). To screen true epithelial cell outlines from outlines of cytological debris, a simple intensity cutoff for Hoechst fluorescence was employed. Additional metrics were computed from the Hoechst fluorescence values and used to identify noncellular debris as explained in the debris filtering section.

Cellular outlining from cytokeratin. A large epithelial cell cluster is surrounded by several smaller clusters and individual cells. The image of raw cytokeratin fluorescence, from positively stained epithelial cells (a), is used as an input for the software outlining algorithm. Outline results are drawn in pink around recognized cells and clusters and are subsequently measured for size and location (b). The Hoechst fluorescent image is used to aid in discriminating real cells from debris (c).
Cellular outlining from cytokeratin. A large epithelial cell cluster is surrounded by several smaller clusters and individual cells. The image of raw cytokeratin fluorescence, from positively stained epithelial cells (a), is used as an input for the software outlining algorithm. Outline results are drawn in pink around recognized cells and clusters and are subsequently measured for size and location (b). The Hoechst fluorescent image is used to aid in discriminating real cells from debris (c).
The outlining process for cytokeratin images was as follows: the image was background subtracted to eliminate any intensity offsets. Subsequently, the image was converted into a binary image using Renyi’s entropy thresholding which was selected for its robustness in determining proper threshold values across a variety of images [29]. Median filtering was applied to the binary image to remove any single pixel noise [30,31]. Two binary morphological operators were applied to the image in order to connect disjoint sets of pixels: a binary closure and a binary opening [32]. Finally, a connected component algorithm, wherein adjacent white pixels were grouped together to create a set of boundary pixels, was applied to obtain outlines of objects in the binary image [33]. The pixel coordinates of each outline were mapped back to the original image for the calculation of cellularity metrics to distinguish epithelial cells and cell clusters from debris.
Debris Filtering
Fibers, dust, cellular fragments, and nonspecific staining, hereafter collectively referred to as ‘debris’, can all fluoresce as brightly as stained cells in fluorescence imaging; consequently the debris will also be outlined by the above mentioned steps and cannot be distinguished from true epithelial cells by a simple intensity cutoff. In the previous study by Cortes-Mateos et al. [13], this issue was overcome by manually removing image tiles with significant debris from the image set prior to analysis. For the current study, a method of automatic rejection of noncellular outlines based on quantitative metrics was developed. After the initial outlining process had been performed on an image, candidate outlines were screened on an individual basis by 4 different debris filters based on properties of the fluorescence intensity distribution:
(1) Hoechst and cytokeratin each exclusively stain different regions of the cell, i.e. the nucleus and the cytoplasm, respectively. Therefore, the features of an epithelial cell or cell cluster appear significantly different in each channel. In contrast, fibers, dust, and some nonspecific staining in a fluorescence image tend to look highly similar in both the Hoechst and cytokeratin channels. If the coefficient of variance of the cytokeratin and Hoechst fluorescence of an outline were within 5% of each other, the outline was rejected (fig. 3a, b).

Examples of noncellular debris screened by filters (a, c, e, g: Hoechst images; b, d, f, h: cytokeratin images). a, b Large area of nonspecific staining containing nuclei. Standard deviation refers to the staining intensity of Hoechst and cytokeratin within an outline. The cytokeratin standard deviation is 26.18%, and the Hoechst standard deviation is 26.35%. This feature is classified as debris since the standard deviations of the 2 channels are within 5%. c, d Piece of dust fluorescing similarly in both channels. With a cytokeratin and Hoechst correlation coefficient of 0.896, the piece of dust is determined to be noncellular. e, f Fiber with highly uniform fluorescence. The Hoechst standard deviation is 10.36%, exhibiting hardly any variability across the feature. g, h Cells near the edge of a large air bubble generate an outline with a large amount of empty space. A circularity of 0.06 indicates that the outline is erroneous.
Examples of noncellular debris screened by filters (a, c, e, g: Hoechst images; b, d, f, h: cytokeratin images). a, b Large area of nonspecific staining containing nuclei. Standard deviation refers to the staining intensity of Hoechst and cytokeratin within an outline. The cytokeratin standard deviation is 26.18%, and the Hoechst standard deviation is 26.35%. This feature is classified as debris since the standard deviations of the 2 channels are within 5%. c, d Piece of dust fluorescing similarly in both channels. With a cytokeratin and Hoechst correlation coefficient of 0.896, the piece of dust is determined to be noncellular. e, f Fiber with highly uniform fluorescence. The Hoechst standard deviation is 10.36%, exhibiting hardly any variability across the feature. g, h Cells near the edge of a large air bubble generate an outline with a large amount of empty space. A circularity of 0.06 indicates that the outline is erroneous.
(2) An additional filter was employed to take advantage of the achromaticity of fiber and dust. If the correlation coefficient of the cytokeratin and Hoechst fluorescence was 0.75 or greater, the outline was rejected; an example is shown in figure 3c, d.
(3) Another filter was established which eliminates outlines of debris with a lack of features in either channel. For example, nonspecific staining can sometimes be seen as large pools of dye in a fluorescence image with a relatively flat intensity distribution. If the cytokeratin or the Hoechst percent standard deviation was 25% or less, the outline was rejected; an example is shown in figure 3e, f.
(4) Air bubbles created during the immunofluorescent staining process have a tendency to collect unbound stain at their borders, causing their edges to fluoresce brightly during imaging (fig. 3a; bottom left). Outlines of these bubble edges sometimes included a number of epithelial cells, allowing them to pass the above mentioned filters (fig. 3g, h). However, the characteristic long and narrow shape of these outlines can be detected by measuring its circularity. Circularity is the ratio of the area of a shape to the area of a circle with the same perimeter; long, narrow shapes have low circularity. Outlines of this type of debris were screened out by rejecting all outlines with a circularity value less than 0.2.
Using an independent test set of slides, cutoff values for the filters were determined by manually measuring the properties of a large number of debris outlines and choosing values to screen out the large majority of debris while minimizing the removal of valid cellular outlines. Identical cutoff values were employed for all slides that were studied. With a larger patient study, establishing a classified training set with machine learning algorithms or neural networks would further optimize the effectiveness of these debris filters.
Epithelial Cell Density
The epithelial cells from positive margins often appeared on the imprint cytology slides in dense clusters. Multilayer cell clusters and cell overlap make it difficult to obtain outlines of individual epithelial cells within a dense cluster. This overlapping of cells was not a critical issue in this study since the presence of a large cluster of epithelial cells was a very strong indicator of the presence of cancer in the margin. The number of epithelial cells in the epithelial cell cluster was calculated by dividing the area of an outline of the entire cytokeratin-positive cluster by 200 µm2, the estimated average area of a single epithelial cell. This method assumes that all clusters occupy a 2-dimensional plane, thereby undercounting the number of epithelial cells in multilayered clusters. Since the same estimated epithelial cell area was used for all cases, the actual value used was irrelevant when comparing cellular density. Cellular density for a slide was determined by dividing the total number of epithelial cells by the scanned area of the slide. For all surgical cases, the slide with the highest determined density is reported.
Results
Debris Filtering
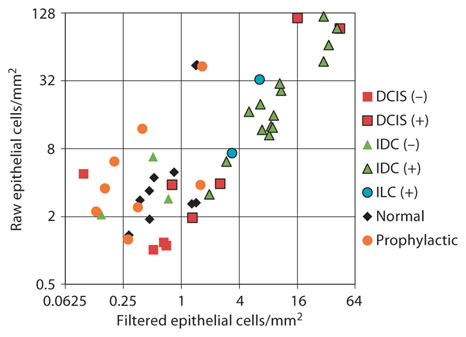
Automated debris filtering was qualified on an independent test set of patient slides from a previous study where manual removal of debris had been employed. The test set consisted of slide images from 24 cancer patients and 10 noncancer patients, 34 in total [13]. The image-processing algorithm described above was employed to identify potential cells and cell clusters. The manual average epithelial cell density for a given slide was calculated after visually inspecting and manually removing images containing debris outlines from the density calculation. The automated average epithelial cell density was calculated by establishing cutoff values for the filtering metrics. After optimization of debris filter cutoff values, strong correlation between manual and automated filtered epithelial cell density was achieved over 4 orders of magnitude in the test set of slides. The optimized cutoff values were used for debris filtering with the patient slides discussed in this paper (fig. 4). The correlation coefficient between the manual and automated filtering was 0.93 over 4 orders of magnitude in cell density, and the slope of the regression line was near unity. This suggests that the cellular counts with automated debris filtering are nearly equivalent to those of the manually filtered image set. A regression line with a slope greater than or less than unity would indicate overfiltering or underfiltering, respectively. The few outliers that deviate from the regression line are sampled across different diagnoses, signifying that automated debris filtering is equally effective across all types of cases. Additionally, automated filtering removes individual outlines of debris within an image rather than removing an entire image from the data set as was done during manual filtering. This should improve the accuracy of cellular detection, particularly for slides with a low cellular density.

Manual versus automated debris filtering. Automated debris filters were tested against manual removal of debris on a data set encompassing a mixture of cancer and noncancer patients (n = 34). Automated filtering matched the results of manual filtering with a high correlation (0.93).
Manual versus automated debris filtering. Automated debris filters were tested against manual removal of debris on a data set encompassing a mixture of cancer and noncancer patients (n = 34). Automated filtering matched the results of manual filtering with a high correlation (0.93).
The cellular densities of slides were compared before and after debris filtering. As shown in figure 5 for prophylactic and normal cases, debris filtering reduced the apparent cell density by up to a factor of 25. Several of the imprint cytology slides from normal and prophylactic patients contained large amounts of debris; if no debris filtering were employed, these slides would appear to have as high a cellular density as cancerous cases. After debris filtering, the average number of epithelial cells for noncancer (normal and prophylactic tissue) and negative cancer cases dropped by over an order of magnitude (9.18 vs. 0.667 epithelial cells/mm2) whereas the average for positive cancer cases dropped by less than a factor of 2 (34 vs. 13.2 epithelial cells/mm2).
Cellular densities before and after debris filtering. Cellular density was compared before (raw epithelial cells/mm2) and after (filtered epithelial cells/mm2) automated debris filtering. For most cancer cases, debris filtering had a relatively small impact on cellularity while an up to 25× decrease was observed for noncancer cases. Several normal and prophylactic cases were found to have large amounts of dust, fibers, and nonspecific staining which resulted in high cellularity measurements before filtering. Automated filtering of image outlines eliminates false positives from noncellular debris on touch prep slides.
Cellular densities before and after debris filtering. Cellular density was compared before (raw epithelial cells/mm2) and after (filtered epithelial cells/mm2) automated debris filtering. For most cancer cases, debris filtering had a relatively small impact on cellularity while an up to 25× decrease was observed for noncancer cases. Several normal and prophylactic cases were found to have large amounts of dust, fibers, and nonspecific staining which resulted in high cellularity measurements before filtering. Automated filtering of image outlines eliminates false positives from noncellular debris on touch prep slides.
Typically, filtering had a small impact on the cellular distributions of positive invasive cancer cases while clearly eliminating areas with high debris on prophylactic and normal cases. Cellular density before and after filtering for a representative prophylactic case and a representative invasive ductal carcinoma (IDC) case are plotted in figure 6. For the prophylactic case, debris filtering most prominently removed areas along the edge of the slide where air bubbles trapped between the slide and coverslip along with nonspecific staining generated a large number of erroneous outlines. Manual inspection of the slide verified that the vast majority of erroneous outlines were screened out by the debris filters. For the IDC cases, debris filtering removed approximately half of the initial outlined area, but the overall distribution of cells on the slide remained unchanged. While some weakly stained or poorly focused cells may be eliminated by debris filtering, the overwhelming bias against noncellular artifacts greatly enhances analysis results.
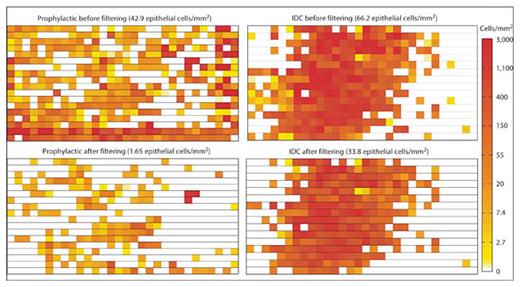
Cellular distributions for prophylactic and IDC samples before and after debris removal. The effect of debris filtering was investigated by plotting the cellular density of each image taken of a touch prep slide. A typical prophylactic case would be expected to show low cellularity; however, initial outlines indicate a falsely high cellular density along the edges of the slide (top left). After debris filtering had been performed, debris outlines along the edge of the slide were properly removed, resulting in a 25× reduction in overall cellularity (bottom left). A typical IDC case showed highly dense clusters of cells in the middle of the slide (top right). After debris filtering, the cellular distribution on the slide remained unchanged while the overall cellularity dropped by only 2× (bottom right).
Cellular distributions for prophylactic and IDC samples before and after debris removal. The effect of debris filtering was investigated by plotting the cellular density of each image taken of a touch prep slide. A typical prophylactic case would be expected to show low cellularity; however, initial outlines indicate a falsely high cellular density along the edges of the slide (top left). After debris filtering had been performed, debris outlines along the edge of the slide were properly removed, resulting in a 25× reduction in overall cellularity (bottom left). A typical IDC case showed highly dense clusters of cells in the middle of the slide (top right). After debris filtering, the cellular distribution on the slide remained unchanged while the overall cellularity dropped by only 2× (bottom right).
Epithelial Cell Density
For cancer cases, each case was determined to be either positive or negative based upon analysis by a pathologist. All prophylactic and breast reduction cases were considered to be part of the negative population. On average, the positive cancer cases were found to have 13.15 epithe- lial cells/mm2 while the negative cases only had 0.6677 epithelial cells/mm2 with standard deviations of 13.4 (101.9%) and 0.5 (74.97%), respectively. The high degree of variability in the measurement of epithelial cell density made it unlikely to be a robust differentiator between positive and negative cases; however, a 2-sided t test for unequal variances showed a significant difference between the 2 populations, with p < 0.01.
Fractional Coverage
In order to increase the robustness of separating noncancer and negative cancer cases from positive cancer cases, an additional metric was calculated. Cancer cases exhibit a high density of epithelial cells across large fractions of an imprint cytology slide surface; figure 6 shows a representative IDC case where nearly half of the slide has a high density of epithelial cells. In contrast, noncancer cases show only a few small regions with epithelial cells. The few epithelial cells present in benign cases reflect either capture of epithelial cells from a duct ruptured in surgery or possibly some debris missed by filtering. To capture this 2-dimensional characteristic of the distribution of the epithelial cell density, several scalar metrics were tested. Calculating the percentage of images with a cellular density of at least 5 epithelial cells/mm2 provided the best scalar quantification of cellular distribution across a whole slide. This distribution metric was found to be 35.9% on average for positive cancer cases and 4.21% on average for noncancer and negative cancer cases, with standard deviations of 0.168 (46.7%) and 0.0324 (76.9%), respectively. A 2-sided t test for unequal variances was performed with p < 0.001, revealing a highly significant difference between the positive and negative groups.
While neither metric on its own provides a perfect separation between the positive invasive cancers and noncancer and negative cancer populations, plotting both on a 2-dimensional graph (fig. 7) shows a high degree of separation. Using discriminant analysis, an optimally separating cutoff line can be drawn between the 2 populations [34].

Two-dimensional discrimination for cancer detection. The % images >5 cells/mm2 versus filtered epithelial cells/mm2 is shown. Using 2 measurements produces a clear separation between positive cancer cases (data points with black outlines) and noncancer and negative cancer cases (normal, prophylactic, and nonoutlined data points); note that 0 false positives and only 3 false negatives were observed. False negatives are the symbols outlined in black below the cutoff line.
Two-dimensional discrimination for cancer detection. The % images >5 cells/mm2 versus filtered epithelial cells/mm2 is shown. Using 2 measurements produces a clear separation between positive cancer cases (data points with black outlines) and noncancer and negative cancer cases (normal, prophylactic, and nonoutlined data points); note that 0 false positives and only 3 false negatives were observed. False negatives are the symbols outlined in black below the cutoff line.
Sensitivity, specificity, and accuracy results of the automated analysis are tabulated in table 1. Specificity was 100% in all tissue types as no false positives were detected. Invasive cancers including invasive lobular carcinoma (ILC) and IDC (ILC + IDC, n = 20) were properly classified with a high degree of accuracy (94.4%), with a single case of IDC reported as a false negative. For the reported false-negative IDC case, local pathological evaluation revealed that IDC was present in only 1% of the frozen tissue section slide with a single cluster of cancer cells approximately 100 microns in length. Two cases of ductal carcinoma in situ (DCIS; n = 9) were reported as false negatives. In both of these cases, the pathologist found only a single focus of low-grade DCIS. The cellular density of all false-negative cases was too low to distinguish them from noncancer cases. Manual inspection of the slides for these cases confirmed that the slides contained very few epithelial cells, thus indicating a limitation of using epithelial cell counts as a marker for positive margins.

Discussion
Compared to previous results from Cortes-Mateos et al. [13], the accuracy of invasive cancer detection (IDC + ILC) by automated detection with debris filtering and locally calibrated samples increased from 80 to 95% and the accuracy of DCIS increased from 40 to 77.8% across a similar patient population [13]. The increase in accuracy was achieved through the implementation of debris filtering in conjunction with establishing a highly localized pathological review. In particular, automated debris filtering made a significant contribution to the achievement of 100% specificity. Several would-be false-positive normal and prophylactic cases saw a significant reduction in the overall cellular density measurement (fig. 7). Relative to Cortes-Mateos et al. [13], the establishment of local pathological analysis helped improve the sensitivity measures and validation of the technique. Since permanent section analysis was not performed on the tissue immediately being sampled by imprint cytology in the previous study, it is likely that many of the imprint cytology samples did not actually sample cancerous tissue, thus overestimating the figures for false negatives.
The major source of error in this study was likely due to the difficulty of orienting imprint slides on the cross sections of small tumors where the foci of cancer were sometimes as small as a few hundred microns. For very small tumors inside large cross-sectional tissue samples, the cancer only occupied a small portion of the cross-sectional tissue surface; it is likely that the cancer was subsequently missed during imprint cytology. Therefore, it is possible, for very small tumors, that the pathologist found cancer in parts of the cross sectional tissue sample which were not sampled by any imprint cytology slides.
These findings are consistent with previous studies using bright-field stains for manual intraoperative analysis of breast cancer surgical margins even though these studies relied upon the expertise of cytologists, including manual analysis of cellular architecture and nuclear characteristics. Cox et al. [35] reported an accuracy of 97.3% in manually assessing margin status across 162 cases. Klimberg et al. [36] reported a manually accuracy of 99.3% across 428 patients. However, England et al. [37] and Saarela et al. [38] reported lower manual accuracies of 73 and 78%, respectively. With cytological evaluation experience being the likely differentiator in diagnostic success [8], the use of an automated analysis technique could further the ability to use imprint cytology intraoperatively in areas where expertise is unavailable.
Measurement of nuclear characteristics has long been used in the automated analysis of H&E-stained slides to differentiate between cancer and noncancer [39,40]. A similar approach is being tested to determine if using Hoechst dye could supplement the cellular density measurements to increase accuracy for DCIS. In practice, the presented automated technique could be used intraoperatively to reduce the need for secondary surgeries. The initial preparation and scanning of the slides does not require the presence of a cytopathologist and, if necessary, a pathologist could remotely review and confirm findings from the digital analysis.
Given that the overall automated analysis technique presented here is targeted towards intraoperative analysis, acquisition time is a critical factor for feasibility. Currently, a typical slide requires 0.5 h to image, including setup time and 5× (1.267 um/pixel) scans. Scanning time can be significantly reduced by coupling a high-resolution camera with lower magnification objectives to reduce the number of images required to scan the same area. With a 16-megapixel camera, it is estimated that the total scanning time can be reduced to 10 min for the 1.267 um/pixel imaging resolution. With higher speed imaging, the imaging time will be the time-limiting factor. Recent work by Iwamoto et al. [26] showed that the antibody staining time can be reduced to 10 min. This is competitive with the time required for intraoperative frozen section analysis.
Conclusion
This automated system in conjunction with intraoperative cytological imprints is a highly sensitive and specific method for the identification of breast cancer. Because of its rapid turnaround time, this method could in the future be applied to imprints of surgical margins and the identification of close or positive margins. The preliminary information would assist in additional tissue removal, if necessary, and significantly reduce the need to perform a second operation at a later time due to positive margins in the final pathology report. The lack of any false positives across the studied patient population is highly encouraging as usage of this technique should not lead to unnecessary removal of extra tissue or cause unnecessary cosmetic deformity. Additionally, the nondestructive nature of imprint cytology preserves tissue for traditional permanent section analysis, ensuring a safety net for any false negatives. Use of the automated microscopy technique would ultimately decrease positive margins rates and the need for second operations in the treatment of early stage breast cancer. This process would entail coordination between the surgeon and pathologist to confirm the automated results and make sure proper sampling of the tumor surface was performed.
Acknowledgements
This research was supported by Department of Defense Idea Grant W81XWH-06-1-052 and NIH-NCI grant 5 U54 CA119335-03.
