

Abstract
Diffusion tensor magnetic resonance imaging (DTI) has proven itself a powerful technique for clinical investigation of the neurobiological targets and mechanisms underlying developmental pathologies. The success of DTI in clinical studies has demonstrated its great potential for understanding translational animal models of clinical disorders, and preclinical animal researchers are beginning to embrace this new technology to study developmental pathologies. In animal models, genetics can be effectively controlled, drugs consistently administered, subject compliance ensured, and image acquisition times dramatically increased to reduce between-subject variability and improve image quality. When pairing these strengths with the many positive attributes of DTI, such as the ability to investigate microstructural brain organization and connectivity, it becomes possible to delve deeper into the study of both normal and abnormal development. The purpose of this review is to provide new preclinical investigators with an introductory source of information about the analysis of data resulting from small animal DTI studies to facilitate the translation of these studies to clinical data. In addition to an in-depth review of translational analysis techniques, we present a number of relevant clinical and animal studies using DTI to investigate developmental insults in order to further illustrate techniques and to highlight where small animal DTI could potentially provide a wealth of translational data to inform clinical researchers.
Introduction
Recently, it has been suggested that many psychiatric disorders have an onset very early in life [1], perhaps even in utero, implying that in order to understand the mechanisms of these illnesses we must investigate them at their earliest stages using longitudinal study designs. Research into the neurobiological etiology of mental illness has been slow to progress in clinical studies, perhaps due to ethical limitations on the types of neurobiological data that can be collected from humans. Few experimental designs lend themselves to intensive study of neurobiological mechanisms in clinical populations; however, magnetic resonance imaging (MRI) has proven itself an invaluable tool for such research. MRI provides a noninvasive window into brain anatomy and function that has no detectable influence over development, and allows for repeated assessments within a single subject. Another important aspect of MRI is its highly translational nature. It stands in the crossroads between clinical and animal research, in that data can be acquired using the same methods in both humans and animals, allowing researchers to investigate the same biological target in multiple species. Thus, findings have the potential to directly translate from basic to clinical science, within reason.
MRI techniques have become a cornerstone of clinical cognitive neurobiology research, and while the number of animal researchers using this technique has increased, it has yet to become as highly popular in animal studies despite its potential value as a translational methodology. Animal researchers have a number of non-MRI tools available that allow for dramatically more flexible neurochemical and anatomical assessment at considerably higher spatial resolution than MRI currently allows. Thus, animal research has justifiably relied upon techniques such as microscopy and electrophysiology. However, despite its shortcomings, MRI still has a considerable number of strengths that can extend the data acquired from more traditional neurochemical and histological techniques, and should not be overlooked by potential researchers. Like histology, MRI can address many neuroanatomical questions, such as a structure’s volume and shape, but can also be used to address questions of regional organization and connectivity. Additionally, MRI can assess a number of global variables that are difficult to measure using highly focused histological assessments.
Historically, MRI researchers have relied heavily upon three types of structural, anatomical imaging: proton density-weighted, T1-weighted, and T2-weighted. Each of these imaging paradigms provide a different image contrast, allowing researchers and clinicians to better visualize particular aspects of the brain. While it is beyond the scope of the current review to discuss the merits of these more traditional forms of imaging (the inquisitive reader can find comprehensive reviews in a study by Symms et al. [2]), it is important to note that the contrasts provided by these imaging techniques allow for the assessment of brain region boundaries similar to some histological techniques, but provide little information regarding the microstructure of a given region or the connectivity between regions.
In contrast, a relatively new imaging technique and the focus of this review, diffusion tensor imaging (DTI), promises to greatly augment our understanding of brain anatomy and may be especially helpful in our understanding of developmental changes. DTI provides a wealth of information for assessing not only the volume and morphology of specific brain regions across developmental periods, but also the organization of these regions and allows the description of fiber tracts within the brain. These measures are particularly relevant to the study of developmental insults in rodent models of human conditions, such as genetic mouse models of disease, exposure to drugs of abuse and other teratogens, or the effects of disturbances in prenatal environment (malnutrition, hypoxia, etc.). Disturbances in brain development following such experimental manipulations often have very subtle effects, many of which may not be apparent when using structural MRI techniques alone.
Small animal investigators who have relied upon traditional histological techniques may find entering into the field of developmental neuroimaging to be daunting, especially from an analysis perspective. Thus, this review is intended to provide newly interested preclinical researchers with a succinct source of basic information that will allow them to begin in this field. First, a very basic review of the theory behind DTI and image acquisition is presented. Additionally, since image analysis is a considerable hurdle in this field, an in-depth review of the strengths/limitations of various analytical techniques is extensively discussed. We focus on DTI selectively due to its relevance to developmental study, as briefly described above, and because of the additional measures it provides that allow for more than histological assessment. Throughout, a number of studies that have used DTI to assess the effects of neurodevelopmental insults (excluding spinal cord injury) are highlighted, primarily to demonstrate the biological questions that can be answered, but also to emphasize the importance and utility of longitudinal designs and to stress the potential translational value of DTI. Where possible, animal models are discussed; however, as this is a relatively new field, DTI has not been widely adopted to investigate animal models of neurodevelopmental disorders. Thus, when no relevant animal study can be found to demonstrate an analytical technique, clinical research has been highlighted to suggest likely translational targets in the brain for preclinical researchers to consider. In addition to the examples presented here, where appropriate, we rely upon our own experience in data collection and analysis as a case study. This review is far from exhaustive and is designed to provide examples and stress important information pertinent to the design and analysis of translational studies on developmental disorders. Although specific disorders are discussed below, readers should not limit their application of these tools to the mentioned disorders. These techniques would be appropriate for usage in a multitude of additional settings, including, but not limited to, animal models of drug and environmental teratogen exposure, early physical trauma, autism, schizophrenia, obsessive compulsive disorder, Down syndrome, Huntington’s disease, depression, anxiety disorders, and numerous other genetic models of typically diagnosed psychiatric disorders.
Diffusion Tensor Imaging
Historically, DTI experiments have loosely followed a similar series of steps from the initiation of the idea to the presentation of results, each building upon the results of the last. These steps include image acquisition, image preprocessing, region-based analysis, voxel-based analysis, fiber tract analysis, and connectivity analysis. These steps can be catered to any particular experimental design, and form an excellent organizational basis for new investigators to start framing their own studies. For more information on the topics covered below, readers should seek out the volume by Johansen-Berg and Behrens [3] for a beautiful and detailed review of all the major concepts that play a role in diffusion MRI.
General Information
Diffusion-weighted imaging, introduced in the late 1980s [4] and in the early 1990s for human studies [5], measures the diffusion of water along a series of directions via the addition of diffusion-sensitizing gradients to a T2-weighted imaging sequence.
One of the common ways of looking at diffusion-weighted imaging data is by estimating the effective diffusion tensor at each voxel in the image [6], resulting in what is commonly known as a diffusion tensor image. Diffusion-weighted images along six unique directions (gradients) are minimally needed for tensor estimation. This tensor representation allows for the straightforward computation of a number of metrics from the data, including fractional anisotropy (FA, discussed in greater detail below) [7].
Diffusion along certain types of tissue, such as white matter (WM) fiber tracts and muscle fibers, is known to be highly anisotropic [8], meaning that it has higher degrees of diffusion along the fibers than perpendicular to them, whereas diffusion in the cerebrospinal fluid typically is isotropic, with no direction preferentiality. In brain WM, this anisotropy is typically explained by the presence of the insulating myelin sheath, as well as the microstructural organization of neurofilaments that restrict the uniform diffusion of water. FA provides a measure of this directional preference.
In contrast, the average diffusion, also known as the mean diffusivity (MD) [9], measures the amount of diffusion regardless of directionality, and has been shown to be a valuable clinical tool in diagnosing acute ischemic stroke [10]. The diffusion along the primary axis of diffusion is known as the axial diffusion (AD) [11], whereas the average diffusion in the other two axes is commonly referred to as the radial diffusion (RD) [12,13,14,15].
In contrast to the rather high level of automation available for human brain image analysis, the standard for small animal brain analysis is still to manually outline brain features in each slice for a large number of scans. These manual methods are problematic in many ways; they lack reproducibility, are biased, and very time-consuming. State-of-the-art acquisition techniques allow for the acquisition of 200-µm isotropic resolution images in approximately 2 h. Thus, the limiting factor for phenotyping studies in large rodent populations is clearly image analysis. High-throughput automatic and reliable analysis methods therefore represent a critical need and when available should be thoughtfully considered when designing new studies.
Small Animal MRI/DTI Acquisition
Entire books [3,16,17] and numerous review articles [e.g. [18,19]] have been published to detail image acquisition, many addressing developmental disorders in particular [e.g. [20,21]]. Interested readers should seek additional information regarding image acquisition from these sources. Although the focus of this paper is image analysis, it would be difficult to adequately discuss these topics without at least a basic understanding of the acquisition process.
Recent advances in high-field MR imaging offer improved signal-to-noise ratio (SNR) and resolution compared to conventional low-field systems. Rodent imaging is typically done with specialized coils and high-field scanners (up to 17.6 T), although there has been research showing the feasibility of using a commercial-grade clinical human scanner for studies that have less stringent requirements on spatial resolution and SNR [22,23]. As for coils, various specialized ones are available ranging from surface coils to phase array and microimaging coils [24]. Coil selection is typically based upon the species and age of the animal since the field of view varies widely among coils. This highlights one potential issue in longitudinal studies. In such studies, the animal typically increases in size during the course of the experiment, such that no single coil may be suitable for all time points. Different coils often yield significantly different images due to SNR and B1 homogeneity differences; thus, any advantage gained by the longitudinal experimental design in terms of reduced variability may be entirely lost. On the other hand, larger brains require a bigger field of view, which changes the voxel size and therefore the SNR. Alternatively, the matrix size can be increased to accommodate the larger brain size while keeping the resolution fixed. The first option may lead to lower FA (due to the SNR change) and the second option to higher FA (due to potentially less partial volume effect), even if there is no true FA change. As these issues suggest, the design of the MR acquisition protocol is closely related to many variables, including coil selection, scan time, desired SNR and resolution. A detailed treatment of these issues is beyond the scope of this review [however, interested readers may find more information in [3,16,17]].
One of the advantages of using DTI in small animals, compared to human imaging, is the possibility of much longer scan times. For ex vivo rodent imaging, scan time is only limited by scanner time availability; 48-h weekend scans are not uncommon. For in vivo imaging, scan time is typically limited by how long the specimen can be safely anesthetized; even so, adult animals can be scanned for several hours. The benefit of increased scan time is higher resolution as well as increased SNR. The SNR can be further improved via one of many available contrast enhancers that can be used in or ex vivo that are not fit for use in human studies. Finally, there are inherent benefits to using rodent models, such as the capability to augment the MRI results with traditional histology, as well as the possibility to control many variables from genetics to environment, and thus focus on the effects of the particular disease or developmental process in question.
One of the major limitations of DTI is its basic assumption that the diffusion in each voxel can be represented by a single tensor. In human brain imaging, where typical voxel sizes can be easily as high as 2 mm3, this assumption fails in regions where multiple fiber bundles of various spatial orientations may be packed together in a single voxel. This situation is commonly referred to as ‘crossing’ or ‘kissing’ fibers and some researchers estimate it to occur in as high as one third of the WM volume [25]. This problem is considerably alleviated but not eliminated in small animal imaging where voxel sizes (typically in the order of magnitude of 100 µm) are much closer to the fiber bundle diameters. Many extensions of the simple tensor model, such as two- or three-tensor models or higher-order tensors [26,27] have been proposed to overcome this shortcoming.
DTI Analysis in Small Animals
Image analysis can easily be one of the most time-consuming and complex stages of any DTI study, and is thus the focus of the remainder of the review. Dozens of analysis tools are available for investigators, some automated and many manual. With so many tools available, image analysis can easily be driven by the tools available instead of the research question. Considering the sheer amount of data that can be drawn from DTI images, new investigators would do well to select only the tools necessary to address the endpoints of the specific study, thus maintaining statistical power and reducing overall study duration. Regardless of the tools selected, there are typically a number of steps necessary to acquire data from DTI images, including image preprocessing, atlas selection/construction, region-based analysis, voxel-based analysis, fiber tract-based analysis, and connectivity analysis. Many studies will not require all the aspects covered here, although it may be beneficial for new investigators to be aware of the types of data that can be generated from DTI studies; thus, each is discussed below.
Preprocessing
In general, some preprocessing steps are necessary on DTI data [28]. These include rigid registration of individual gradient images to the baseline image to minimize motion effects, correction of intensity inhomogeneities, as well as the rigid alignment of the whole data to a template to remove positional differences (translation and rotation). If more than 6 gradient directions are available, an additional step might be used to detect any inconsistencies in the data due to motion, pulsation, etc. and perhaps exclude those images with reduced scan quality. Since less than 6 images is not enough for tensor estimation, problems in any one of these images would result in exclusion of the entire dataset from analysis. Thus, when possible, collecting more than 6 gradient images would be beneficial.
DTI Atlases
One of the problems with rodent MRI/DTI analysis currently is the lack of reliable atlases, especially during the early postnatal development stages. Without such atlases, many of the automated processing steps outlined above become unavailable. Typically, additional images are used for the creation of an atlas that fits the specific population of interest. These images can be deformably registered and averaged together to create an atlas image. This atlas can then be processed by human experts to delineate regions of interest (ROIs). It is important that the atlas is constructed from a population rather than a single individual to prevent bias in studies that use the atlas. These are commonly called variational atlases as they contain information about not just the average brain, but also the normal variation around this average. Some of the prominently used atlases in the community are summarized below.
• C57 Brookhaven atlas [29] comprises T2*-weighted scans of 10 adult male mice using a 17.6-tesla scanner at 47 µm isotropic resolution. This atlas has been segmented into 20 anatomical structures.
• Mouse BIRN atlas [30] was built from T2-weighted scans of 11 female adult mice acquired with an 11.74-tesla scanner at 60 µm isotropic resolution.
• The Waxholm atlas [31] includes 4 adult male C57 mice and includes T1, T2, T2* at 21.5 µm and DTI images at 43 µm resolution as well as Nissl-stained sections.
• Kovacevic et al. [32] built an atlas from nine 8-week-old male mice at 60 µm isotropic resolution.
• The Developmental Mouse atlas [33,34,35] is a series of atlases of developing mouse embryos. The atlases include FA, diffusion-weighted images, T2-weighted, and tensor maps collected from mouse fetuses at embryonic days 14–17.
The Mouse BIRN, Brookhaven, Waxholm, and the Developmental Mouse atlases are publicly available; the others might be available upon request from the authors. In our own work, we are currently preparing variational DTI atlases for postnatal day (PND) 5 and 14 rat pups as well as adult rats (Sprague-Dawley), and C57 mouse atlases for PND 45 and PND 80, each based on 10–20 animals, which will be made publicly available upon completion. Developmental atlases existing in the literature, much like traditional histological atlases, are acquired from a single specimen [33,35,36,37]. Zhang et al. [38] seem to compute a variational atlas, although the population size is not indicated; since they indicate their landmark-based approach is not applicable to large populations, we conclude this work uses only a few animals to demonstrate feasibility. The only developmental variational rodent brain atlases, to our knowledge, are proposed by Bockhorst et al. [39], Larvaron et al. [40], and Chahboune et al. [41]; however, these are based on in vivo scans at low resolution, with a slice thickness as large as 0.5 mm (the average adult rat brain is approximately less than 2.0 cm long, for perspective).
DTI typically produces lower-resolution images than structural MRI as the available scan time needs to be divided among several gradient-sensitized images. Attempting to achieve the same resolution in a given time window would result in significant SNR reduction. One possible solution to circumvent this tradeoff would be to acquire high-resolution structural images, sometimes also referred to as magnetic resonance microscopy [29,42,43,44,45], that can be coregistered with lower-resolution DTI scans. This allows atlas segmentation to be completed on the higher-resolution magnetic resonance microscopy scans, and propagated to the DTI atlas.
Region-Based Analysis
While one of the available routes of investigation is the analysis of the diffusion-weighted MR image intensity itself [46,47], this approach is rather sensitive to noise and strongly dependent on scan parameters compared to relative metrics such as FA. These scalar diffusion measurements, discussed in ‘General Information’ above, can be computed and analyzed in various ROIs. The average and standard deviation of these measurements in each region [48,49,50,51,52], as well as the regional volumes [53,54,55,56], can be used for comparing different populations.
There are several methods available for segmenting the ROIs in individual images. The simplest, but most labor-intensive method is to have an anatomical expert manually segment these regions in each image. In addition to being slow and tedious, this method is also typically subject to large interexpert variability, which can often confound potentially subtle group differences in the dataset. Despite these drawbacks, this method is still the typical approach in rodent MRI analysis. A more desirable approach is to have the expert segment an atlas image, and use deformable registration techniques to precisely align the atlas with each individual image. The resulting deformation fields can then be used to carry the ROI labels over to each individual image [57]. An additional benefit of deformably registering the atlas to the individual image lies in the analysis of the deformation field itself [58,59,60]. This type of analysis assumes that a normal subject’s scan will require different types of deformation than an abnormal subject to be registered to the atlas. The deformation properties can also be analyzed across various ROIs as discussed in ‘Voxel-Based Analysis’ below.
Once the brains have been segmented into ROIs, the most basic level of analysis that can be conducted is simply a measure of volume for a particular ROI. Such measures have been conducted in countless clinical studies, and do not specifically rely on DTI for data acquisition. Animal studies lend themselves particularly well to this type of analysis, as the echo-planar imaging sequences that are typically used in human studies do not allow for volume estimation. Rapid acquisition with relaxation enhancement (RARE) sequences are more typically used in rodent imaging, and volumetric data can easily be collected under these protocols. Such a technique can be used clinically though, as was done by Alexander et al. [61] in an investigation of WM maturation in autistic young adults. One aspect of the analysis conducted in this study compared the number of voxels included in an ROI between groups. This comparison showed significant reductions in the volumes of all subregions of the corpus callosum in autistic individuals.
A second example demonstrating the usage of specific ROIs in DTI analysis can be found in figure 1, taken from Stone et al. [50] in a study of the long-term effects of early hypoxia-ischemia. Stone et al. utilized the various contrasts resulting from a DTI scan to manually select their ROIs. For example, the contrast provided by the diffusion-weighted images was used to define the boundaries of the whole brain and lateral ventricles, but both the diffusion-weighted and direction-encoded color maps were used to define the boundaries of the septum and hippocampus. This technique demonstrates the usage of multiple contrasts to determine the best boundary for a region, and should be encouraged when performing manual ROI selection. Results from this study demonstrated a significant impact of hypoxia-ischemia on the regions examined, with the extent of damage dependent upon the interval following the insult. For example, hippocampal volume changes were evident only 24 h following injury, while alterations in septal volume are not evident until much later. This important finding highlights the value of longitudinal investigations in proposed preclinical models of this disorder and others, and demonstrates effective usage of volumetric measurement in a developmental study. Such techniques can translate very well to animal models where existing behavioral and neurobiological data could be used to direct hypotheses.
![Fig. 1. An ROI-based examination of the volumetric differences in C57BL/6J mice on PND 42 following PND 7 hypoxic-ischemic brain injury [50]. Here, the authors demonstrate, in rostro-caudal order, manual ROI selections of the septal region (a) and hippocampus (b). The resolution of these images was 0.125 mm3. The authors highlight other potential ROIs, including the anterior commissure (ac), anterior part of the anterior commissure (aca), corpus callosum (cc), external capsule (ec), fornix (f), forceps major of the corpus callosum (fmj), and ventral hippocampal commissure (vhc). Results from this study demonstrated a significant impact of hypoxia-ischemia on the regions examined, with the extent of damage dependent upon the interval following the insult. While only volumetric differences were examined in this study, it would be possible to examine FA, MD, AD, and RD using similar methods. LV = Left ventricle.](https://karger.silverchair-cdn.com/karger/content_public/journal/dne/34/1/10.1159_000336825/2/m_000336825_f01.jpeg?Expires=1716352391&Signature=jpxfgqWFebaP~M0qjC72t-kakUtHUPuDZ1ZD9Gc5bQqBUfN4sYwJ2W1nSAP5Cwe6nPHtbKps4mHU8AqEXtNhbouLyut7Gpq9spWcpYOhKZU-dAYEfuHAHizcpxkpjvU5knpdjWYzQI3v45aLBjjd1WUS2EULNE1r-l4Xsp9QbUlJ5Q7KyRDF1jp4xTKfKBeVnxBkjPi-V4wY05~jom9DFWl9XFHgwnebSGU4NqbsyLT~ANlMsEXtL3EhOaMCInFO4Mj2KU46DH00Xm5gv65ocMeF6BgS4PqQ5RlTsFXU982jhTNBnxMnti~TfwA3jKmoy3WOo~Z3AysCybFEsd6RUA__&Key-Pair-Id=APKAIE5G5CRDK6RD3PGA)
An ROI-based examination of the volumetric differences in C57BL/6J mice on PND 42 following PND 7 hypoxic-ischemic brain injury [50]. Here, the authors demonstrate, in rostro-caudal order, manual ROI selections of the septal region (a) and hippocampus (b). The resolution of these images was 0.125 mm3. The authors highlight other potential ROIs, including the anterior commissure (ac), anterior part of the anterior commissure (aca), corpus callosum (cc), external capsule (ec), fornix (f), forceps major of the corpus callosum (fmj), and ventral hippocampal commissure (vhc). Results from this study demonstrated a significant impact of hypoxia-ischemia on the regions examined, with the extent of damage dependent upon the interval following the insult. While only volumetric differences were examined in this study, it would be possible to examine FA, MD, AD, and RD using similar methods. LV = Left ventricle.
An ROI-based examination of the volumetric differences in C57BL/6J mice on PND 42 following PND 7 hypoxic-ischemic brain injury [50]. Here, the authors demonstrate, in rostro-caudal order, manual ROI selections of the septal region (a) and hippocampus (b). The resolution of these images was 0.125 mm3. The authors highlight other potential ROIs, including the anterior commissure (ac), anterior part of the anterior commissure (aca), corpus callosum (cc), external capsule (ec), fornix (f), forceps major of the corpus callosum (fmj), and ventral hippocampal commissure (vhc). Results from this study demonstrated a significant impact of hypoxia-ischemia on the regions examined, with the extent of damage dependent upon the interval following the insult. While only volumetric differences were examined in this study, it would be possible to examine FA, MD, AD, and RD using similar methods. LV = Left ventricle.
While anisotropy and diffusion measures are informative of brain anatomy independently, there is perhaps some additional information to be garnered by examining the relationship between FA and MD as demonstrated in Alexander et al. [61]. Here the typical negative linear relationship between FA and MD was observed in the control images, but an even stronger linear relationship was found in subjects with autism spectrum disorder. While the utility and anatomical relevance of this type of data at a single time point is currently unclear, this could potentially be a useful measure to examine changes over time in the relationship that exists between these variables.
An additional measure of interest available to developmental DTI researchers is cortical thickness. This measure can be calculated from MRI or DTI images once the neocortex has been segmented. Note once again that using DTI for a structural analysis in such a manner can only be done in small animals, as the eddy current distortions are typically prohibitive in human DTI protocols. A typical method would be to set up a Laplace equation to create streamlines between the inside and outside boundaries of the neocortex such that the potential field mimics the layers of the cortex; the cortical thickness can then be estimated as the length of these streamlines [62,63]. Cortical thickness shows dramatic variability over the developmental period. Typically, cortical thickness and cortical volume increase throughout childhood, and then decline again during adolescence; however, this typical temporal relationship can be disturbed following developmental insult, as in the study by Tamnes et al. [64]. In addition to describing the methods, Lerch et al. [62] also demonstrate the usage of these techniques in a genetic mouse model of Huntington’s disease (YAC128). Here, the authors examined the entire cortex of adult mice (9,000 points in total) and showed an increase in the thickness of the sensorimotor cortex. While Lerch et al. only examined this measure in adulthood, the strong relationship that exists between age and cortical architecture presents a particularly sensitive target for developmental insult and should be strongly considered by translational researchers when designing studies. However, when using this measure the choice of developmental time point can easily bias the data, and strict care needs to be taken to ensure that data are collected at similar developmental ages. This is one study design aspect that particularly favors small animal imaging, as the entire life span of the subject is accessible to researchers, ensuring that data collection can occur at the same developmental age.
Voxel-Based Analysis
Although region-based analysis is useful in cases where the expected group differences are big or spread over large regions, it could lead to false negatives if the differences are small or limited to a smaller region than the chosen ROIs, because the regional analysis averages data across the whole region. A more localized method is voxel-based analysis [65]. In this approach, the individual images are deformably registered, typically using one of the scalar measurements. Then, other scalar measurements can be used for analysis on a voxel-by-voxel basis [66,67]. For example, if the FA was used for registration, then the analysis can be done on MD, AD, or RD measurements. This technique, while perhaps not very hypothesis oriented, can reveal a wealth of information about potential targets, and can quickly highlight pathways of interest. However, this should not be relied upon as the only analysis type, as statistical power is low in such a model, increasing the likelihood of type II error (false negative).
The usage of such a technique was nicely demonstrated in a study of opiate- and polydrug-exposed children [68]. In addition to this technique, Walhovd et al. [68] also employed an interesting registration technique worth noting, in which every subject was registered to every other subject, and the most typical subject (least warping required to align other images to it) selected as the atlas image. Alternatively, a study-specific atlas could be constructed or a previously validated atlas image used in place of this step. Once the atlas image was selected, a voxel-wise comparison of FA, AD, and RD, similar to the comparison used by Brubaker et al. [69], was performed. Data from this study found significant alterations in diffusion variables common among drug-exposed children in a number of both cortical and subcortical regions. Cortical region differences will be harder to examine in small animal models than in clinical populations, due to a lack of anatomical boundaries between cortical subregions, and identification of subcortical regions will be dependent upon the resolution of the scan and the contrast of the image, which is related to the developmental time point examined. One potentially serious complication with this type of study design is that it relies on a very high FA signal to create the skeleton for analysis. In our experience, such a signal is often difficult to acquire, especially at early developmental time points. Regardless, this technique shows much promise as a high-throughput screen to target new regions for investigation in animal models, especially at later developmental time points.
Deformation field analysis, as discussed above in ‘Region-Based Analysis’, can also be performed on a voxel-wise basis. Typically, acquired images are normalized to a standard space through a series or rigid and deformable registrations before analysis. The amount of warping required to fit the brain to a normalized space can be regionally dependent, and thus a potentially interesting measure in and of itself. For example, an increase in the volume of a region or altered shape of a region would result in an increase in the amount of warping. Such analysis was mentioned briefly above in our discussion of the study of Walhovd et al. [68], which used measures of deformation to establish a target brain upon which other images would be registered. While this usage of the deformation field is certainly useful and valid, Walhovd et al. could easily have included the warping characteristics as an endpoint in their study.
Few developmental studies have capitalized on this technique as of yet; however, deformation field analysis (also called tensor morphometry) has been used to study the trajectories of normal postnatal development [70] and in a number of studies examining adult rodents following the impact of various developmental insults [71,72]. Baloch et al. [70] present a particularly impressive study of normal development, examining both FA and volumetric effects using deformation field analysis. To accomplish this, maps of deformation were created based on the information used to warp subject brains to developmentally appropriate atlases. These maps were then compared across development to generate the data presented in figure 2. Although the study by Baloch et al. was completed in a ‘normal’ population, it is easy to extrapolate how such analysis techniques could have direct relevance to populations affected by developmental insults, where exposure to teratogens could alter the growth of specific brain regions. Additionally, similar to the whole-brain voxel-wise analysis reviewed above, this technique can rapidly highlight volumetric differences in brain regions for further exploration.
![Fig. 2. Deformation field analysis of FA results from an investigation of mouse brain maturation over the postnatal period (PND 2–40) [70]. Difference maps (percent change) between young and old C57BL/6J mice, highlighting change in older compared to younger brains. Grey matter cortical and hippocampal regions show a drop in FA values over time (indicated by blue), whereas white matter structures, such as internal and external capsule, and the genu and splenium of the corpus callosum, show an increase in FA values (indicated by red). Comparing this normal trajectory of development to mouse models of developmental disorders could prove very informative. Colors refer to the online version only.](https://karger.silverchair-cdn.com/karger/content_public/journal/dne/34/1/10.1159_000336825/2/m_000336825_f02.jpeg?Expires=1716352391&Signature=QH9sdOJuJO0UYSsmVYBIuKpBtZQ5--JrhHWMdrmhtSBa1d9VyReEuA2Y5CtWnJOFZYnPNNPQ9HYo4vH3v~vwURLx-7GtzGyUUM-ZOroqZwf-DbZhXvLQ3bZUHtI1HFeFlMmm36pBE6DLQ3g1qPRFrWNefbjKkOw91w1MTSsYljrkDKqgeGLDg6eguZRJF2j2yA8ct6FO8aAw9uL8qm3bnfLOHDBLLKfRM4cAW6Ks5NnkANP47d4y3IYNH82CPUfBeUXcgfRebPyO1FIAaFbRshi-vaov1hS3ycrUNJmAqCzrXFEdoDD~xrMvaf3-7S--DPxCBtEo0E6uaVfjhqnZOQ__&Key-Pair-Id=APKAIE5G5CRDK6RD3PGA)
Deformation field analysis of FA results from an investigation of mouse brain maturation over the postnatal period (PND 2–40) [70]. Difference maps (percent change) between young and old C57BL/6J mice, highlighting change in older compared to younger brains. Grey matter cortical and hippocampal regions show a drop in FA values over time (indicated by blue), whereas white matter structures, such as internal and external capsule, and the genu and splenium of the corpus callosum, show an increase in FA values (indicated by red). Comparing this normal trajectory of development to mouse models of developmental disorders could prove very informative. Colors refer to the online version only.
Deformation field analysis of FA results from an investigation of mouse brain maturation over the postnatal period (PND 2–40) [70]. Difference maps (percent change) between young and old C57BL/6J mice, highlighting change in older compared to younger brains. Grey matter cortical and hippocampal regions show a drop in FA values over time (indicated by blue), whereas white matter structures, such as internal and external capsule, and the genu and splenium of the corpus callosum, show an increase in FA values (indicated by red). Comparing this normal trajectory of development to mouse models of developmental disorders could prove very informative. Colors refer to the online version only.
Fiber Tract-Based Analysis
In addition to voxel- and region-based analysis of scalar diffusion measurements, the diffusion directionality data provide a wealth of information unique to DTI. The directionality itself can be used to visually detect abnormalities [73,74], or tractography methods can be used to further explore the data in DTI scans [75,76]. An example of such visualization can be found in figure 3. Tractography can be done on an individual basis, starting with seed regions that can be either manually selected or propagated from an atlas similar to other ROIs. However, deterministic tractography has some limitations such as handling crossing fibers (locations where multiple tracts come together) and high sensitivity to noise. More reliable results can typically be obtained either by guiding tractography with ROI placement based on a priori knowledge or by performing tractography on the atlas, which has better SNR, and then propagating the reconstructed tracts to each subject [77]. This again supports the argument for using an atlas-based method rather than processing individual subjects independently. In addition to qualitative analysis of the tractography results to detect any major abnormalities (such as agenesis of corpus callosum), a quantitative analysis can be performed by comparing the diffusion properties along fiber tracts [78]. This method tends to be able to detect subtle differences in the dataset since the measurements it compares are strongly localized. Combining tractography with the hypothesis-generating nature of voxel-based analysis can provide a thorough analysis of the DTI data.
![Fig. 3. a–d In vivo 3D fiber reconstruction of the adult rat brain taken from the study by Xue et al. [78]. Tensors were calculated from 6 diffusion-weighted images at a resolution of 256 × 128 × 64 µm. The tractography is presented atop a single representative 2D slice (nontypical slice orientations) to allow for anatomical association. The seed regions used for tractography included genu of corpus callosum (light blue), splenium of corpus callosum (pink), fimbria (blue), internal capsule (red), optic tract (green), stria terminalis (peach), and anterior commissure (yellow). This provides an excellent example of the usage of DTI in small animal subjects and demonstrates its feasibility. Data collected from such studies can be used to quantitatively examine the various fiber tracks, which are likely targets of numerous developmental insults. Colors refer to the online version only.](https://karger.silverchair-cdn.com/karger/content_public/journal/dne/34/1/10.1159_000336825/2/m_000336825_f03.jpeg?Expires=1716352391&Signature=KmSfXxqL0a9-nThdRWfCfL31BVc03vI97gsThVUxdP8UPo4kit~D0EsatIMtIQNbAdOn2Fk97lo5U8k2aofpMEdqoZv8odF3adyBznR-JlyyBZQrqn2q4uQg-omHgwBTvVSAjA~TVHfkmFS1NJFuqX47SR8NnQjw4e7-V7THJ5I6uKEzrfh6X3i-pB-2pLW0aBRDPx0mWtah3Hh34jOobex1knd8WXviPc05BaNBGp0X5W1stI0I77z2CMlPCL016Dm4ToVzPfk5hXsdwkJW6Q-OcWy1jPKedzAc854DOpqvJEWk6h9pfuQnzluIpzrzECsfEHUshPjRMktFdEQlKw__&Key-Pair-Id=APKAIE5G5CRDK6RD3PGA)
a–d In vivo 3D fiber reconstruction of the adult rat brain taken from the study by Xue et al. [78]. Tensors were calculated from 6 diffusion-weighted images at a resolution of 256 × 128 × 64 µm. The tractography is presented atop a single representative 2D slice (nontypical slice orientations) to allow for anatomical association. The seed regions used for tractography included genu of corpus callosum (light blue), splenium of corpus callosum (pink), fimbria (blue), internal capsule (red), optic tract (green), stria terminalis (peach), and anterior commissure (yellow). This provides an excellent example of the usage of DTI in small animal subjects and demonstrates its feasibility. Data collected from such studies can be used to quantitatively examine the various fiber tracks, which are likely targets of numerous developmental insults. Colors refer to the online version only.
a–d In vivo 3D fiber reconstruction of the adult rat brain taken from the study by Xue et al. [78]. Tensors were calculated from 6 diffusion-weighted images at a resolution of 256 × 128 × 64 µm. The tractography is presented atop a single representative 2D slice (nontypical slice orientations) to allow for anatomical association. The seed regions used for tractography included genu of corpus callosum (light blue), splenium of corpus callosum (pink), fimbria (blue), internal capsule (red), optic tract (green), stria terminalis (peach), and anterior commissure (yellow). This provides an excellent example of the usage of DTI in small animal subjects and demonstrates its feasibility. Data collected from such studies can be used to quantitatively examine the various fiber tracks, which are likely targets of numerous developmental insults. Colors refer to the online version only.
Tractography is best accomplished in highly myelinated regions where FA signal is high, such as the corpus callosum. Reconstruction in smaller regions, or regions where signal is low, will require significantly higher signal to noise to offset the tensor uncertainty. This usually translates into longer scan times or reductions in scanning resolution. Acquiring data along many additional gradients, as well as dramatically increasing scan time, has even allowed tractography in gray matter structures such as the hippocampus [79,80]. While this may not be practical in clinical studies, small animal studies have the benefit of using longer scan times and higher strength gradient coils to offset these potential issues. However, scan times should be limited to only the time necessary to acquire the data of interest for in vivo protocols, since anesthesia can have long-term implications on development [81]. If these data collection limitations can be overcome, data resulting from tractography studies can provide information above and beyond that of simple FA and diffusivity characteristics to demonstrate WM integrity, where potential pathway differences exist, and likely targets for additional effects. Additionally, tractography can provide more accurate classification of WM tracts and highlight potential alterations in the connectivity between regions.
Glenn et al. [82] provides an excellent example of the strength of tractography in a developmental setting. Children previously diagnosed with congenital hemiparesis were the population of interest in this study, and tractography was used to examine the relationship between WM tract malformations and behavioral motor deficits. Glenn et al. were specifically interested in the pyramidal tracts, as these were likely to be the source of any motor deficits caused by the disorder. Thus, seed regions were selected within the cerebral peduncle, internal capsule at the level of the globus pallidus, and the precentral gyrus. Only tracts that passed through all three of these regions were included in the final analysis. Once tractography was completed, specific ROIs along these tracts were selected to compare FA, MD, AD, and RD between groups. These measures were used to examine asymmetry within the region, revealing significant correlations between the extent of asymmetry and the extent of motor deficits in these children. While using tractography to improve ROI identification is a valid usage of tractography, we are just beginning to touch the surface of what can be done with such analytical techniques. It is feasible that shape analysis techniques will come to bear on such data to illustrate when paths are abnormally redirected, allowing for unprecedented characterization of brain growth and development, especially with the improved magnet strength and scanning duration available to small animal imagers.
Connectivity Analysis
In addition to these local diffusion measurements, DTI can be used to extract more global information about the connectivity of WM fiber tracts in the brain. Integrating the principal direction of preferred diffusion, also known as streamline tractography, allows for reconstructing the pathways of the major fiber bundles [83]. Other methods that rely on stochastic algorithms use probabilistic representations of the local diffusion to allow for multiple diffusion orientations per voxel and create probabilistic connectivity maps among different brain regions [84]. Yet another class of techniques adopts a Hamilton-Jacobian approach and tries to compute connectivity by minimizing a global objective function that can be formulated either as a maximum probability or a minimum cost problem [26,85,86].
An approach from human DTI literature [87,88,89] that can be applied to the rodent scale is network analysis of fiber connectivity. The main idea of network analysis is to compute a connectivity matrix of strengths or probabilities between all brain regions and then analyze this connectivity matrix to discover its features, such as a core network. Applying these techniques to rodents would result in a rat or mouse ‘connectome’, which may help in understanding the course of development of fiber connections and its disorders. Furthermore, functional MRI data can be used in connection with these DTI network analysis methods to reveal sites of functionally and structurally connected brain areas.
Live versus Postmortem Imaging
One of the main concerns in imaging sequence design is whether the animal will be scanned in vivo or postmortem. While live imaging is more attractive from both a translational point of view and the possibility of longitudinal studies [90,91,92,93], it has several limitations. Since the animal has to be anesthetized during image acquisition, the scan has to be relatively short, typically less than 3–4 h for an appropriate resolution. This leads to reduced resolution, decreased SNR, fewer gradient directions, or a combination of these, as shown in figure 4. Depending on the nature of the study, there might be additional concerns regarding the effect of the anesthesia on both long- and short-term development [81], as well as the strain placed on the animal during the whole process. In our own work, we have had considerable trouble keeping animals, especially young pups, alive while maintaining a high enough anesthesia dose to prevent motion artifacts for a long enough scan time to ensure adequate SNR. While an extensive review of MRI contrast agents is beyond the scope of this paper [see [94]], it is noteworthy that postmortem imaging may allow for the use of contrast agents such as Prohance to increase SNR; however, some of these agents may not be appropriate to use with live developing animals or humans due to their toxicity and concerns about their retention levels in blood as well as in the kidneys and lungs [95,96].
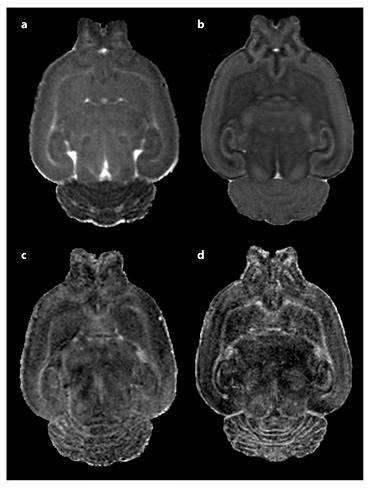
MD (a, b) and fractional anisotropy (c, d) images of a PND 14 Sprague-Dawley rat pup brain. Following in vivo image collection shown in a and c, the subject was perfused, decapitated, and whole head reimaged ex vivo shown in b and d. In vivo scanning was accomplished under isoflurane anesthesia in our Bruker 9.4-tesla MRI. A 3D RARE sequence was used with diffusion gradients applied in six noncollinear directions. Total scan time of approximately 2.5 h, resulting in a resolution of 0.15 × 0.16 × 0.17 mm. Ex vivo imaging was accomplished overnight via another RARE DTI scan protocol with 21 diffusion direction images at an isotropic voxel size of 0.12 × 0.12 × 0.12 mm. The total scan time was approximately 15.5 h. By comparing these two images, we can see both the greater resolution and SNR of the fixed brain images, which came at the cost of reduced translational relevancy and the sacrifice of a longitudinal study design.
MD (a, b) and fractional anisotropy (c, d) images of a PND 14 Sprague-Dawley rat pup brain. Following in vivo image collection shown in a and c, the subject was perfused, decapitated, and whole head reimaged ex vivo shown in b and d. In vivo scanning was accomplished under isoflurane anesthesia in our Bruker 9.4-tesla MRI. A 3D RARE sequence was used with diffusion gradients applied in six noncollinear directions. Total scan time of approximately 2.5 h, resulting in a resolution of 0.15 × 0.16 × 0.17 mm. Ex vivo imaging was accomplished overnight via another RARE DTI scan protocol with 21 diffusion direction images at an isotropic voxel size of 0.12 × 0.12 × 0.12 mm. The total scan time was approximately 15.5 h. By comparing these two images, we can see both the greater resolution and SNR of the fixed brain images, which came at the cost of reduced translational relevancy and the sacrifice of a longitudinal study design.
A major obstacle to good-quality in vivo imaging is motion artifacts that may be due to either ‘shaking’ of the anesthetized animal and/or residual respiration. In more severe cases, images with such motion might be extremely blurred. Shorter acquisition times help overcome motion sensitivity of the acquisition; however, shorter acquisition time implies either reduced SNR, reduced resolution, or both. Reduced SNR makes analysis generally more difficult as more noise is introduced; subtle differences might go undetected, and larger populations might be necessary for detectable differences to reach statistical significance. Reduced resolution, on the other hand, may result in digitization artifacts that typically appear as ring artifacts on the reconstructed images. This can cause problems in the analysis by obscuring the boundaries between various ROIs, especially near the neocortex, as well as increasing the noise in cortical thickness measurements.
Another type of artifact that often occurs in in vivo imaging is pulsation artifacts. These typically manifest themselves as high-intensity spots in the image, which sometimes can appear as a checkerboard pattern. These artifacts can be prevented by either flow compensation or cardiac gating methods, both of which increase scan duration. If the artifact is relatively small, the data can still be used for analysis after applying a local smoothing filter to the artifact region.
Regardless of whether imaging is accomplished postmortem or not, all of the MRI/DTI endpoints discussed here can also be analyzed in a larger experimental context, integrating any additional data that might be available to the investigators, such as behavioral data, body weight, etc. [97,98,99]. For example, changes in behavior can be correlated with local cortical thickness or regional FA to reveal potential physiological causes [100]. Furthermore, volume and organization data can be collected from an animal, and immediately following imaging, tissue can be harvested from the same animal for intensive molecular and/or genetic analysis. Integrating MRI/DTI analysis with traditional histology data is also very useful for validation of MRI findings [101,102,103], enriching the MRI data with many histological stains [104,105], as well as enriching the 2D histology data with the 3D brain structure that is free of distortions introduced by slicing [106,107]. This type of study design is perhaps especially useful, as it pairs anatomical data with cellular/molecular data in a manner highly translational to human studies. Such methodology is nicely demonstrated by Van Camp et al. [108] while investigating an animal model of Huntington’s disease. Using DTI, the authors of this work reported alterations in FA, AD, RD, and MD within the internal and external capsula and subregions of the caudate putamen. These results were paired with histological examination of the same regions, which found alterations in astroglia in the external capsule and evidence of necrosis of WM structures in the internal capsule and caudate, thus highlighting numerous potential mechanisms through which DTI properties may be altered. An additional strength of this work was the addition of behavioral data to the DTI and histology data, which further reinforces the significance of their findings, and suggests even more potential mechanisms that may contribute to the loss of function seen in this model.
A number of other studies are currently using such designs, but one serious limitation of findings from such studies is the general lack of histological validation of MRI results. Almost all histological techniques require a number of tissue alterations to allow for staining. Dramatic effects on tissue volume and structure can occur at all levels of histological preparation. Fixation alone can cause dramatic shrinkage of tissue and alterations in ventricle structure. Such factors need to be considered when creating histological comparisons for imaging measures. Despite these potential confounds, many groups [109,110,111,112,113,114] have looked into the validation of DTI in postmortem rodent brains, including the effect of fixation, brain tissue decomposition, as well as postmortem delay before imaging on diffusion measurements. These studies show that while the relative diffusion measurements (such as FA) are comparable between in vivo and ex vivo images, the absolute measurements of diffusion (such as MD) can differ drastically from those calculated in live animals.
Conclusions
As discussed above, DTI is a very flexible tool that can be used to provide a wealth of information regarding gross malformations in brain volume and morphology, but can also elucidate subtle alterations in brain connectivity and organization. While the tool has enormous translational potential, animal studies must be designed to maximize this potential by focusing on clinically relevant measures and developmental time points, and by providing carefully matched controls unavailable to clinical populations. Such measures include regional volume, FA, diffusivity (including mean, axial, and radial), deformation field analysis, connectivity within and between ROIs (including tractography and connectivity maps), and cortical thickness analysis. When these tools are combined with the other strengths of animal models, a more complete picture containing the malformations caused by developmental disorders as well as their mechanisms can be developed.
Developmental insults almost always occur across both the prenatal (e.g. teratogen exposure) and postnatal environments (e.g. parental care deficits), and rigorous controls must be used to isolate these effects. Furthermore, brain development occurs rapidly, thus extreme care must be taken to ensure that data from all subjects are collected at the same developmental age to avoid missing the moving target. While this typically poses a problem in clinical studies, animal models can overcome such limitations, by implementing tight control over nonspecific effects such as the genetic background and early rearing environment, while ensuring that data collection occurs at the same developmental age in all subjects and that subjects comply in long-term longitudinal studies. Additionally, small animal scans can be acquired to provide translational relevance to clinical studies, and then immediately followed with histological extension of MRI findings in the same brain to provide additional mechanistic data. This type of analysis is rarely available to human researchers, and alone provides justification for further utilization of these techniques in animal studies. Such designs would not only extend the data collected from MRI, but would also bolster the internal validity of the MRI study results. Despite these considerable strengths, MRI is just beginning to play a role in small animal research, perhaps due to limitations imposed by the availability of equipment, trained staff, and the current relatively high cost of image acquisition. However, as the importance of translational experimentation increases, we anticipate more widespread adoption of MRI by animal researchers.
One of the major shortcomings of traditional DTI is the single-tensor model that it assumes. While this model can adequately capture the microstructure in certain brain regions, it is not capable of representing crossing fibers. This poses substantial problems with robust tractography, because crossing fiber locations appear to have isotropic diffusion, which is typically a stopping condition for tractography methods. These problems can be largely overcome by using a multitensor model, with the most common one being two-tensor models (rather than one). In this case, two separate tensors are fit at each voxel. If the two tensors are essentially parallel, they can be merged into a single tensor since there is not enough evidence in the data to support two tensors in such locations. While a two-tensor model would be a considerable improvement over a single-tensor model, estimation of two tensors requires considerably more directions than the six required for the estimation of only one direction (above 30 is recommended), thus increasing scan time or decreasing SNR. An even further step away from single-tensor representations is high angular resolution diffusion imaging (HARDI) and Q-ball imaging. These approaches rely on acquiring many more diffusion gradient directions, such that a full orientation distribution function can be estimated. To our knowledge, there have not been any attempts at HARDI or Q-ball imaging in the whole rodent brain (Ozarslan and Mareci [115] and Bar-Shir et al. [116] looked at HARDI in excised tissue in their method development work). While there are no theoretical reasons why this cannot and should not be done, there are many practical reasons (extremely long scan time).
Acknowledgements
We are grateful to Ashley Rumple for editorial assistance. We would also like to acknowledge the financial support of the Carolina Institute for Developmental Disabilities, National Institute on Drug Abuse grants P01DA022446 and F31DA026251, UNC Neurodevelopmental Disorders Research Center HD 03110, NIH STTR grant R41 NS059095, NIH grant RC1AA019211, UNC Bowles Center for Alcohol Studies, as well as NIH grants AA06059, AA019969, and AA020022. The funders had no role in the study design, data collection and analysis, decision to publish, or preparation of the manuscript.
References
I.O. and M.S.M. contributed equally to the manuscript.
