

Abstract
African mormyrid fishes are by far the most diverse group of osteoglossomorph (bony tongue) fishes. Mormyrids communicate using pulses of electricity, and they process electric communication signals in the midbrain exterolateral nucleus (EL). In its ancestral form, the EL is relatively small and homogenous. In two different lineages, however, the EL expanded in size and increased in cytological complexity. This evolutionary change established the perceptual ability to distinguish variation in electric pulse waveform, which plays an important role in species recognition and mate choice. However, the sensory basis of social behavior in species with a small, homogenous EL remains unknown. Using published species descriptions, we found that species in one of these lineages have relatively large eyes. Using sectioned brains, we measured the volume of a major visual region, the optic tectum (OT), and found that this same lineage also has an enlarged OT. We also found that eye size and OT size are highly correlated across species. Phylogenetic analysis suggests that a reduced visual system evolved with the origins of an active electrosense, and that this one particular lineage secondarily evolved an enlarged visual system. Behavioral tests revealed that this enlargement of the visual system established increased visual acuity. Thus, our findings demonstrate that different lineages of mormyrids have evolved visual or electrosensory specializations, but that no lineages have specialized in both. This sensory divergence likely reflects fundamentally different ecologies and suggests that vision may play an especially important role in the social behavior of mormyrids that cannot detect variation in electric signal waveform. Our findings provide an example of evolutionary change in multiple sensory systems among closely related species that lays a foundation for relating ecological adaptation to evolutionary change in multisensory perception and social behavior.
Introduction
Sensory systems can evolve in response to selection arising from a variety of biotic and abiotic factors. In extreme cases, differences between the environments of closely related species can lead to lineage-specific sensory specializations. For example, certain cavefish have lost vision completely, and this is compensated for by enhanced taste buds and mechanoreceptive neuromasts [Jeffrey et al., 2000; Yoshizawa et al., 2012], as well as the evolution of active hydrodynamic imaging [Hassan, 1989; Windsor et al., 2008, 2010]. Evolutionary change in sensory systems can have important consequences for species diversification because it can influence the perception of communication signals in the context of mate choice [Ryan, 1986, 1998; Boughmann, 2002; Seehausen et al., 2008; Carlson, 2012]. Thus, comparing evolutionary change in sensory systems between closely related lineages can help elucidate the selective pressures that have shaped sensory system evolution and how this may have impacted behavioral diversification.
African mormyrid fishes are an excellent model system for studying sensory system evolution. There are more than 200 identified species, making it the most diverse group of osteoglossomorph (bony-tongued) fishes [Carlson and Arnegard, 2011] and one of the fastest radiating families among all ray-finned fishes [Rabosky et al., 2013]. Mormyrids have a passive electrosense and an active electrosensory system used for communication and navigation. The evolution of active electrosensing is thought to be related to a nocturnal lifestyle associated with decreased reliance on vision [Lazar et al., 1984; Wullimann and Northcutt, 1990; Moller, 1995; Kramer, 1996]. However, mormyrids do use vision in a variety of behavioral tasks [Moller et al., 1982; Teyssedre and Moller, 1982; von der Emde and Bleckmann, 1998; Moller, 2002; Rojas and Moller, 2002; Schuster and Amtsfeld, 2002]. Their eyes also exhibit morphological specializations for low-light level vision [Landsberger et al., 2008; Kreysing et al., 2012].
Recently, we discovered a dramatic example of evolutionary change in the electrosensory system of mormyrids [Carlson et al., 2011]. Electric communication signals are detected by a specific type of electroreceptor called a knollenorgan, which gives rise to a central electrosensory pathway that is employed solely for the analysis of electric communication signals [Xu-Friedman and Hopkins, 1999; Baker et al., 2013]. Electric signal analysis first takes place in the exterolateral nucleus (EL) of the midbrain. In some mormyrid species, the EL is enlarged and subdivided into cytologically distinct anterior (ELa) and posterior (ELp) nuclei, whereas other mormyrids have a relatively small, undivided EL [Carlson et al., 2011]. Phylogenetic reconstruction suggests that EL is the ancestral character state, and that ELa/ELp evolved twice independently, once within the subfamily Mormyrinae and once within the only other mormyrid subfamily, the Petrocephalinae. Mormyrids with an ELa/ELp can detect variation in the temporal structure of electric signal pulse waveforms, whereas those with an EL cannot, and this perceptual difference is associated with dramatic differences in rates of signal evolution and species diversification [Carlson et al., 2011].
A previous anatomical study of the mormyrid species Gnathonemus petersii revealed that their visual brain regions are reduced in size compared to nonmormyrids [Wullimann and Northcutt, 1990], suggesting that the evolution of an active electrosense may be related to decreased reliance on vision. However, there has not yet been a comparative study among mormyrids to assess whether species differences in the electrosensory system correlate with species differences in the visual system. We demonstrate here that one lineage of mormyrids with a small EL electrosensory brain region has evolved an enlarged visual system and higher visual acuity when compared to closely related species, suggesting that different lineages of mormyrids have evolved distinct sensory specializations in response to different environments.
Materials and Methods
Relative Eye Size Measurements
To compare relative eye size across species, we determined the ratio of eye diameter to standard length (ED/SL) for 186 mormyrid species and 9 outgroup species using published species descriptions [Boulenger, 1909; Weber and de Beaufort, 1913; Harder, 2000; Hopkins et al., 2007; Lavoué et al., 2010]. For each species, we obtained the maximum and minimum eye diameter to head length ratio (ED/HL) and head length to standard length ratio (HL/SL) directly from these sources. We calculated the median ED/HL and median HL/SL from the maximum and minimum values, and then multiplied these to calculate the median ED/SL. If multiple sources listed different ED/HL or HL/SL ranges for the same species, then we used the mean of the median ED/SL values.
Brain Region Volume Measurements
To measure the volume of the optic tectum (OT), a major visual region of the midbrain, we used fixed, sectioned and Nissl-stained mormyrid brains available from a previous study of EL and ELa/ELp volume [Carlson et al., 2011]. This material was originally obtained from a mixture of laboratory-housed fish, field-caught fish and museum specimens. Laboratory specimens were anesthetized in 300 mg/l MS-222 and perfused through the heart with Hickman's ringer followed by 4% paraformaldehyde in 0.1 M phosphate buffer. Fish caught in the field were anesthetized in 300 mg/l MS-222. Their heads were cut off, part of the skull was removed and the heads were then immersion-fixed in 4% paraformaldehyde in 0.1 M phosphate buffer. Specimens from the Cornell University Museum of Vertebrates had been fixed in 10% phosphate-buffered formalin for 2 weeks and then stored in 70% ethanol. In each case, fixed brains were removed from the skull and then post-fixed in 4% paraformaldehyde in 0.1 M phosphate buffer for a few days, and then embedded in gelatin and post-fixed overnight prior to slicing. We used a vibrating microtome to obtain 50-µm horizontal sections, mounted these on chrome-alum subbed slides, and then allowed at least 24 h for the sections to dry. We then stained sections with cresyl violet or neutral red, dehydrated them in a graded alcohol series, cleared them with xylene and coverslipped them. These procedures were in accordance with guidelines established by the National Institutes of Health and were approved by the Animal Care and Use Committee at Washington University in St. Louis.
The OT is easily recognizable due to its size, position and striated pattern of staining owing to its laminated morphology [Laufer and Vanegas, 1974; Meek and Schellart, 1978; Romeskie and Sharma, 1979; Wullimann and Northcutt, 1990; Northcutt, 2002]. We determined the OT volume of 47 specimens from 25 different species. In each section, we measured the cross-sectional area of the left and right OT. We summed these cross-sectional areas and then multiplied the summated areas by section thickness (50 µm) to calculate total volume. We averaged the left and right OT volumes to obtain an average OT volume per fish and then normalized these values by total brain mass, measured after post-fixing and prior to embedding. We compared normalized OT volumes to normalized EL volumes from the same individuals, measured in the same way in a previous study [Carlson et al., 2011]. To determine whether our measurements of normalized EL and OT size may have been influenced by fixation method, we performed two separate analyses of variance (ANOVA) with species and fixation method as independent variables, and either EL or OT size as the dependent variable. Although EL size varied significantly among species (F23,21 = 7.31, p < 0.0001), there was no significant effect of fixation method (F1,21 = 1.58, p = 0.22). Similarly, OT size varied significantly among species (F23,21 = 8.44, p < 0.00001), but there was no significant effect of fixation method (F1,21 = 0.42, p = 0.52). There were thus no systematic differences in EL volume or OT volume depending on the original fixation method.
Phylogenetic Comparative Analysis
We used phylogenetic generalized least squares (PGLS) to assess phylogenetic signal and correct for nonindependence in regressions due to common ancestry [Garland and Ives, 2000; Garland et al., 2005; Nunn, 2011]. Phylogenetic signal (λ) is estimated by scaling the variance-covariance matrix of a phylogenetic tree to determine the extent to which covariation between traits is due to shared ancestry or correlated evolutionary change. This phylogenetic signal is then incorporated into the PGLS analysis. PGLS determines whether there is a linear correlation between two traits with phylogenetic relatedness incorporated into the error term using the variance-covariance matrix derived from the phylogenetic tree and the best-fit phylogenetic signal based on maximum likelihood.
A tree with known and supported phylogenetic topology and branch lengths is needed for PGLS. We used MEGA5.1 for tree building and sequence alignment manipulation. We built a bootstrapped maximum likelihood tree from 28 cytb sequences from mormyrid species, and rooted the tree with sequences from species in the outgroups Notopteridae (Xenomystus nigri) and Gymnarchidae (Gymnarchus niloticus). The tree was then pruned to include only the lineages for which we had phenotypic data. Since we had phenotypic data from some species for which we did not have cytb sequence data, we averaged phenotypic data from species within the monophyletic clades Paramormyrops, Pollimyrus, Stomatorhinus and Myomyrus. There were no major differences in trait values within these clades, and the monophyly of these four genera is strongly supported by several previous phylogenetic studies [Alves-Gomes and Hopkins, 1997; Lavoué et al., 2000; Sullivan et al., 2000, 2002; Lavoué et al., 2003; Sullivan et al., 2004; Lavoué et al., 2008a, 2008b, 2010]. Phenotypic data from species in these clades were averaged and then matched with a cytb sequence from a species within their respective clades. We used cytb sequences from Campylomormyrus tamandua, Campylomormyrus numenius, G. petersii, Marcusenius moorii, Ivindomyrus marchei, Paramormyrops hopkinsi, Pollimyrus adspersus, Brienomyrus brachyistius, Isichthys henryi, Stomatorhinus walkeri, Mormyrops zanclirostris, Myomyrus macrops, Petrocephalus microphthalmus, P. balayi, P. sullivani, P. soudanensis, P. zakoni, P. simus, P. grandoculis, P. pulsivertens and P. valentini. All of these sequences were published previously and are available on GenBank [Sullivan et al., 2000; Lavoué et al., 2003, 2004; Feulner et al., 2007; Lavoué et al., 2008b, 2010, 2012]. We performed PGLS in R using the package caper. We set both κ and δ equal to 1, which assumes a stable rate of evolutionary change over time in a Brownian motion framework. We used the maximum likelihood value of λ (λML) to incorporate the phylogenetic signal that provided the best fit to the model.
Determining Relative Visual Acuity Using the Optomotor Response
To obtain a behavioral measure of visual acuity, we used the optomotor reflex response, in which a fish swims with a moving visual stimulus to maintain a fixed position with respect to its background. Previous studies have demonstrated optomotor reflex responses in two mormyrid species [Teyssedre and Moller, 1982; Landsberger et al., 2008; Kreysing et al., 2012]. Our setup consisted of a 30-cm-diameter white plastic drum surrounding a circular, transparent Plexiglas fish tank with a diameter of 23 cm and a central ‘pole' which was a PVC pipe with a diameter of 6 cm. We placed removable transparencies with printed, black, vertical-stripe patterns on the inner surface of the drum. The stripes alternated between 100% opaque black and 100% transparent stripes of equal widths ranging from 0.25 to 16.0 cm. The control was a solid, 50%-opacity gray control. The drum rested on a turntable connected to a gear motor controlled by a switch that rotated the drum in either direction at a constant speed of 9.7 rotations per minute while the fish tank remained stationary. A single length of rope light surrounding the bottom of the drum provided a uniform, low-light intensity of 0.35 µmol photons/s/m2. To minimize room light entering the fish tank, a cardboard box with a peephole in the top enclosed the whole setup. An angled mirror covering the peephole further shaded the fish tank from room light while enabling direct observation of the fish. While watching the fish through the peephole, we recorded the total number of laps swum during visual stimulation. We defined one lap as movement of the fish's head in a 360° rotation in either direction around the central pole in the tank, measured to the nearest quarter of a lap.
In each run, we placed a fish into the tank, turned on the rope light, covered the tank with the box and allowed the fish to acclimate for 30 min. We then rotated a particular stripe width around the fish tank for 62 s (10 rotations), waited 30 s and then repeated the same stripe stimulus but with an opposite direction of rotation. We averaged the responses to both directions of rotation to obtain a single measure of response to a given stimulus. Next, we changed the stripe width and waited 3 min. The procedure was then repeated until all stripe widths and the control were tested. We randomized both the order of stimuli presented and the direction in which we first rotated the drum for each stripe width. We performed 1-4 experiments on each individual, and we averaged data across repetitions if an individual was tested more than once. We performed all statistical analyses of optomotor responses using Statistica 6.1 (Statsoft, Inc.).
We tested the visual acuity of 9 mormyrid species: Brienomyrus brachyistius, Brevimyrus niger, G. petersii, P. adspersus, P. microphthalmus, P. simus, P. soudanensis, P. sullivani and P. tenuicauda. We also tested the visual acuity of 3 nonmormyrid osteoglossomorph outgroup species: Xenomystus nigri, Chitala ornata and Pantodon buchholzi. We used individuals of both sexes ranging from 4.5 to 11 cm in fork length. P. microphthalmus, P. simus and P. sullivani were collected during field-work in Gabon, Africa, and then transported to Washington University in St. Louis, where all the experiments were performed. All other species came from commercial distributors. All species were housed in aquariums with a water conductivity of 200-400 µS/cm, a pH of 6-7 and a 12-hour:12-hour light:dark cycle. Fish were fed live black worms 4 times per week. These procedures were in accordance with guidelines established by the National Institutes of Health and were approved by the Animal Care and Use Committee at Washington University in St. Louis.
Results
Evolutionary Changes in Eye Size among Osteoglossomorph Fishes
The phylogenetic relationships among families of osteoglossomorph fishes have been well established [Lavoué and Sullivan, 2004; Lavoué et al., 2011, 2012]. Mormyrids have been well studied phylogenetically, but a complete species-level phylogeny for this rapidly diversifying family is lacking [Alves-Gomes and Hopkins, 1997; Lavoué et al., 2000; Sullivan et al., 2000, 2002; Lavoué et al., 2003; Sullivan et al., 2004; Feulner et al., 2007, 2008; Lavoué et al., 2008a, 2008b, 2010]. Nevertheless, there are just four major mormyrid lineages relevant to evolutionary change in the knollenorgan electrosensory system, and the phylogenetic relationships among these lineages are well defined [Carlson and Arnegard, 2011; Carlson et al., 2011]. There are two subfamilies of mormyrids, the Mormyrinae and Petrocephalinae, both of which contain two sister lineages, one with a large and subdivided ELa/ELp and one with a small, undifferentiated EL (fig. 1). Within the Mormyrinae, clade A has an ELa/ELp whereas Myomyrus spp. has an EL. Within the Petrocephalinae, the monotypic P. microphthalmus has an ELa/ELp whereas all other petrocephalines have an EL.
![Eye size varies among osteoglossomorph fishes. A consensus cladogram of osteoglossomorph fishes is shown on the left with corresponding median eye diameter to standard length ratios on the right. The cladogram is based on well-established molecular phylogenetic relationships [Lavoué et al., 2000; Sullivan et al., 2000; Lavoué and Sullivan, 2004; Lavoué et al., 2010, 2011]. Bar size represents mean values among species in each lineage and error bars represent standard error (sample sizes indicate number of species included). Grey bars: nonmormyroid outgroup lineages; black bars: mormyroid lineages with a small EL electrosensory nucleus; white bars: mormyroid lineages with an enlarged ELa/ELp electrosensory nucleus.](https://karger.silverchair-cdn.com/karger/content_public/journal/bbe/82/3/10.1159_000355369/5/m_000355369_f01.gif?Expires=1716287596&Signature=nbD-4psSUMmYz~inrdzUXCPSD9r5HuzbaMpkWareKm4ZXCcs832OYdoV0DyGQCZR1iyC5wZHHDxVDgVRt8S9~qm6N460QrUbi9o58kFMYq0BZP6ANlzlcmy90-AS0o4iYQ5u-MP-vOqcaO23QaW3DZCHwI2MuC1awlr9QZKpwanC3DUN7pucjxxJlRBx8HH8fk0yz7FZN4stQSlF3yw~m9DodXcQ0n0zChqgmVa~LaRd0VpMWDyq4-Wyff8gBZA2nja8IVbGHAutUwxRi9fN7G7EhbVG00XOxIhsNmq1~lkuS0WbGJQdodAfRa7Z73GL52zrqghK67RiCtZPwNnjlQ__&Key-Pair-Id=APKAIE5G5CRDK6RD3PGA)
Eye size varies among osteoglossomorph fishes. A consensus cladogram of osteoglossomorph fishes is shown on the left with corresponding median eye diameter to standard length ratios on the right. The cladogram is based on well-established molecular phylogenetic relationships [Lavoué et al., 2000; Sullivan et al., 2000; Lavoué and Sullivan, 2004; Lavoué et al., 2010, 2011]. Bar size represents mean values among species in each lineage and error bars represent standard error (sample sizes indicate number of species included). Grey bars: nonmormyroid outgroup lineages; black bars: mormyroid lineages with a small EL electrosensory nucleus; white bars: mormyroid lineages with an enlarged ELa/ELp electrosensory nucleus.
Eye size varies among osteoglossomorph fishes. A consensus cladogram of osteoglossomorph fishes is shown on the left with corresponding median eye diameter to standard length ratios on the right. The cladogram is based on well-established molecular phylogenetic relationships [Lavoué et al., 2000; Sullivan et al., 2000; Lavoué and Sullivan, 2004; Lavoué et al., 2010, 2011]. Bar size represents mean values among species in each lineage and error bars represent standard error (sample sizes indicate number of species included). Grey bars: nonmormyroid outgroup lineages; black bars: mormyroid lineages with a small EL electrosensory nucleus; white bars: mormyroid lineages with an enlarged ELa/ELp electrosensory nucleus.
To include eye size data from as many species as possible and investigate whether variation in eye size relates to evolutionary change in the knollenorgan pathway, we compared average relative eye sizes (median eye diameter/standard length) across species among the four relevant lineages of mormyrids and four outgroup families (fig. 1). Among mormyrids, the largest eyes were found in the Petrocephalinae. Within the Petrocephalinae, P. microphthalmus had smaller eyes than other petrocephalines. Within the Mormyrinae, Myomyrus spp. had slightly smaller eyes than clade A. The closest related outgroup to mormyrids, the monotypic G. niloticus, had much smaller eyes than all mormyrids, whereas the more distantly related outgroup families Notopteridae and Osteoglossidae generally had eyes of an intermediate size, larger than those of mormyrines and G. niloticus, but smaller than those of petrocephalines. Finally, the most distantly related outgroup family that we studied, the Pantodontidae, had relatively large eyes that were similar in size to petrocephalines.
Different Lineages of Mormyrids Evolved Enlarged Visual or Electrosensory Systems
To directly compare evolutionary change in the visual and electrosensory systems among mormyrids, we determined the normalized EL and OT volumes of 25 species (fig. 2, 3). Of the 23 species from which we also obtained relative eye size data, there was a clear correlation between OT volume and eye size (fig. 4a). Petrocephalines with an EL had larger eyes and larger optic tecta than all other mormyrids studied (fig. 4a). To control for the potentially confounding effect of shared ancestry on this relationship, we performed PGLS on the lineages within this sample having cytb sequence data (fig. 4a). There was no apparent phylogenetic signal (λML = 0), and the PGLS confirmed a significant relationship between relative eye size and normalized OT volume (r2 = 0.69, t20 = 6.56, p < 0.0001). Thus, correlated evolutionary change in eye size and OT size among mormyrids appears to reflect their shared functional role in vision rather than shared ancestry.

Horizontal sections (50 μm thickness) through the midbrains of 10 mormyrid species stained with Cresyl violet. The left column shows 5 species with enlarged and subdivided anterior and posterior exterolateral nuclei (ELa/ELp) and the right column shows 5 species with a small and undifferentiated EL. Scale bars represent 1 mm for all sections. In each section, the locations of EL or ELa/ELp and the OT are indicated. The OT is clearly distinguishable as a laminated structure on the anterolateral margins of the mesencephalon. EL or ELa/ELp is located on the posterolateral margins of the torus semicircularis.
Horizontal sections (50 μm thickness) through the midbrains of 10 mormyrid species stained with Cresyl violet. The left column shows 5 species with enlarged and subdivided anterior and posterior exterolateral nuclei (ELa/ELp) and the right column shows 5 species with a small and undifferentiated EL. Scale bars represent 1 mm for all sections. In each section, the locations of EL or ELa/ELp and the OT are indicated. The OT is clearly distinguishable as a laminated structure on the anterolateral margins of the mesencephalon. EL or ELa/ELp is located on the posterolateral margins of the torus semicircularis.
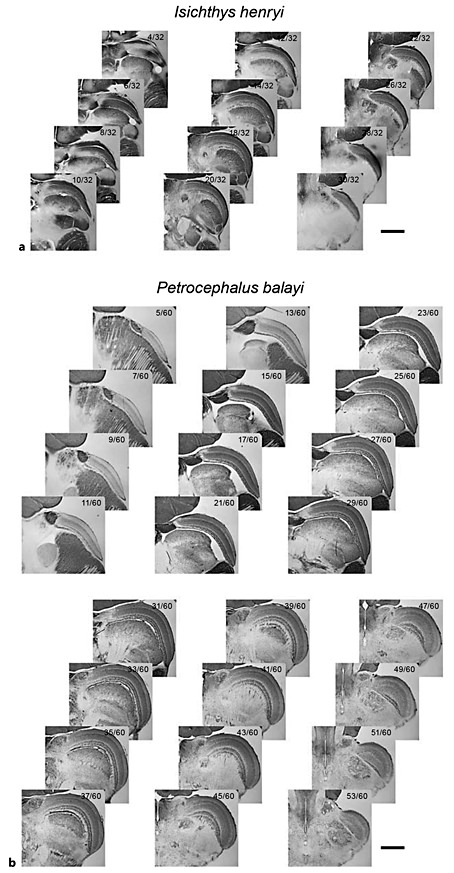
Series of 50-μm horizontal sections through the midbrains of one mormyrid species with an ELa/ELp (Isichthys henryi) (a) and one mormyrid species with an EL (Petrocephalus balayi) (b). Scale bars represent 1 mm. Fractions in the top right corner of each section represent the section number from dorsal to ventral (numerator) relative to the total number of sections containing OT (denominator). As in figure 2, the OT is clearly distinguishable as a laminated structure on the anterolateral margins of the mesencephalon and EL or ELa/ELp is visible at the posterolateral margins of the torus semicircularis. The OT of P. balayi is noticeably larger than the OT of I. henryi, to be seen both in the total number of sections occupied by OT and in the size of OT in each section.
Series of 50-μm horizontal sections through the midbrains of one mormyrid species with an ELa/ELp (Isichthys henryi) (a) and one mormyrid species with an EL (Petrocephalus balayi) (b). Scale bars represent 1 mm. Fractions in the top right corner of each section represent the section number from dorsal to ventral (numerator) relative to the total number of sections containing OT (denominator). As in figure 2, the OT is clearly distinguishable as a laminated structure on the anterolateral margins of the mesencephalon and EL or ELa/ELp is visible at the posterolateral margins of the torus semicircularis. The OT of P. balayi is noticeably larger than the OT of I. henryi, to be seen both in the total number of sections occupied by OT and in the size of OT in each section.

Different mormyrid lineages have experienced evolutionary increases in the size of the knollenorgan electrosensory system or visual system, but not both. a Relationship between median relative eye size and mean normalized OT volume for species in the four major mormyrid lineages shown in figure 1. The plot to the right shows the log-likelihood of different values of λ resulting from PGLS of median relative eye size vs. mean normalized OT volume for all species with cytb sequences. λ can vary from 0 to 1, and it reflects the amount of phylogenetic signal. The maximum likelihood value (λML) occurs at λ = 0, indicating no phylogenetic signal in the correlation between these two variables (λML was significantly different from 1, p < 0.01, but not significantly different from 0, p = 1). The PGLS revealed a significant correlation between median relative eye size and mean normalized OT volume (r2 = 0.69, t20 = 6.56, p < 0.0001). b Relationship between mean normalized EL volume and mean normalized OT volume for species in the four major mormyrid lineages shown in figure 1. In this case, there was a fairly strong phylogenetic signal (λML = 0.669) in the correlation between the two variables (λML was significantly different from 0, p < 0.05, but not significantly different from 1, p = 0.11). Accounting for this phylogenetic signal revealed no significant correlation between mean normalized EL size and mean normalized OT size (r2 = 0.03, t20 = -0.78, p > 0.4).
Different mormyrid lineages have experienced evolutionary increases in the size of the knollenorgan electrosensory system or visual system, but not both. a Relationship between median relative eye size and mean normalized OT volume for species in the four major mormyrid lineages shown in figure 1. The plot to the right shows the log-likelihood of different values of λ resulting from PGLS of median relative eye size vs. mean normalized OT volume for all species with cytb sequences. λ can vary from 0 to 1, and it reflects the amount of phylogenetic signal. The maximum likelihood value (λML) occurs at λ = 0, indicating no phylogenetic signal in the correlation between these two variables (λML was significantly different from 1, p < 0.01, but not significantly different from 0, p = 1). The PGLS revealed a significant correlation between median relative eye size and mean normalized OT volume (r2 = 0.69, t20 = 6.56, p < 0.0001). b Relationship between mean normalized EL volume and mean normalized OT volume for species in the four major mormyrid lineages shown in figure 1. In this case, there was a fairly strong phylogenetic signal (λML = 0.669) in the correlation between the two variables (λML was significantly different from 0, p < 0.05, but not significantly different from 1, p = 0.11). Accounting for this phylogenetic signal revealed no significant correlation between mean normalized EL size and mean normalized OT size (r2 = 0.03, t20 = -0.78, p > 0.4).
All species with an enlarged ELa/ELp had a relatively small OT, including P. microphthalmus and all clade A species (fig. 4b). Of the two mormyrid lineages with a small EL, Myomyrus spp. had a relatively small OT whereas all of the petrocephalines had a relatively large OT (fig. 4b). Thus, there are three distinct electrosensory-visual phenotypes among mormyrids: (1) small visual and small electrosensory systems (Myomyrus spp.); (2) small visual and large electrosensory systems (clade A and P. microphthalmus), and (3) large visual and small electrosensory systems (all other petrocephalines). There were no mormyrid lineages with large visual and large electrosensory systems (fig. 4b).
PGLS on those lineages with cytb sequences revealed a fairly strong phylogenetic signal (λML = 0.669) and no correlation between EL size and OT size (r2 = 0.03, t20 = -0.78, p > 0.4). This indicates that covariation in the sizes of the visual and electrosensory systems was largely due to shared ancestry rather than correlated evolutionary change. A parsimonious interpretation of these results suggests that a relatively small visual system was the ancestral mormyrid character state, and an enlarged visual system evolved in the lineage of petrocephalines having a small, undifferentiated EL. Thus, different lineages experienced evolutionary increases in the sizes of visual or electrosensory pathways, but there is no evidence that these two traits have been coevolving among mormyrids.
Mormyrids with Enlarged Visual Systems Had Better Visual Acuity than Other Mormyrids
We tested visual acuity using the optomotor response in 4 clade A species [B. brachyistius (n = 17), B. niger (n = 14), P. adspersus (n = 7) and G. petersii (n = 13)], 5 petrocephaline species [P. microphthalmus (n = 8), P. tenuicauda (n = 15), P. soudanensis (n = 4), P. sullivani (n = 1) and P. simus (n = 1)], 2 notopterid species [Xenomystus nigri (n = 7) and C. ornata (n = 6)] and 1 pantodontid species [P. buchholzi (n = 9)]. Unfortunately, Myomyrus spp. are rare and limited in their geographic distribution, so we were not able to test them behaviorally. The optomotor reflex has been well studied in many fish species [Jones, 1963]. It occurs when a fish swims in the same direction as a moving visual stimulus, which helps the fish to orient and stabilize itself in water currents [Arnold, 1974; Rock and Smith, 1986]. Scoring optomotor responses to moving visual stimuli can therefore be used to quantitatively assess stimulus detection. Our experimental setup (fig. 5) was similar to that described in a previous study of the optomotor responses of two clade A species, G. petersii and B. niger [Teyssedre and Moller, 1982].

Visual acuity was studied using the optomotor reflex response. The experimental setup used to test visual acuity is shown from the side (a) and from above (b). The fish is placed in a circular tank (diameter = 23 cm) with a vertical pole in the center (diameter = 6 cm). A drum (diameter = 30 cm) rests on a turntable surrounding the tank. Transparencies with vertical stripe patterns or solid gray (control) are placed on the inside wall of the drum. A motor connected to the turntable is used to make the drum rotate in a clockwise or counterclockwise direction at a speed of 9.7 rotations per minute, providing a moving visual stimulus to the fish.
Visual acuity was studied using the optomotor reflex response. The experimental setup used to test visual acuity is shown from the side (a) and from above (b). The fish is placed in a circular tank (diameter = 23 cm) with a vertical pole in the center (diameter = 6 cm). A drum (diameter = 30 cm) rests on a turntable surrounding the tank. Transparencies with vertical stripe patterns or solid gray (control) are placed on the inside wall of the drum. A motor connected to the turntable is used to make the drum rotate in a clockwise or counterclockwise direction at a speed of 9.7 rotations per minute, providing a moving visual stimulus to the fish.
We stimulated fish with a vertical black-and-white stripe pattern that rotated around a circular tank for 62 s at a constant speed of 9.7 rotations per minute (10 rotations in total). We varied the width of the stripes and used a uniform 50% gray as a control. To quantify optomotor responses, we measured the total number of laps each subject swam around the tank, in both directions. A single lap was defined as movement of the fish's head 360° around the pole in the middle of the tank, and we measured to the nearest quarter of a lap. All nonmormyrid species that we studied generally swam in the same direction as the rotating stripes, a typical optomotor response. Interestingly, several mormyrids did not show the typical optomotor response of consistently swimming in the same direction as the stripes, but instead swam more in both directions compared to the control stimulus (fig. 6). Across all species studied, the total number of laps in both directions in response to the largest stripe width tested was significantly larger than the total number of laps in both directions in response to the control (repeated-measures ANOVA: F1,89 = 82.5, p < 0.000001), thus demonstrating a clear behavioral response to visual stimulation. We therefore used the total number of laps made in both directions to quantify behavioral responses to visual stimulation.
The total number of laps swum in response to a rotating visual stimulus provides a quantitative measure of visual responsiveness. The bar graphs show the mean ± s.e.m. for the total number of laps swum in both directions relative to the total number of stimulus rotations in response to a 16-cm stripe width and to an all-gray control. All species swam more in response to the 16-cm stripe width than to the control (repeated-measures ANOVA: F1,89 = 82.5, p < 0.000001). In addition, species differed in their overall levels of activity under both control and stimulus conditions (repeated-measures ANOVA: F12,89 = 6.2, p < 0.000001).
The total number of laps swum in response to a rotating visual stimulus provides a quantitative measure of visual responsiveness. The bar graphs show the mean ± s.e.m. for the total number of laps swum in both directions relative to the total number of stimulus rotations in response to a 16-cm stripe width and to an all-gray control. All species swam more in response to the 16-cm stripe width than to the control (repeated-measures ANOVA: F1,89 = 82.5, p < 0.000001). In addition, species differed in their overall levels of activity under both control and stimulus conditions (repeated-measures ANOVA: F12,89 = 6.2, p < 0.000001).
We also found significant species differences in the total number of laps during both control and stripe stimulation (repeated-measures ANOVA: F12,89 = 6.2, p < 0.000001), reflecting different overall activity levels (fig. 6). Therefore, to compare optomotor responses across species, we normalized the data from each individual to account for varying activity levels using:

where r is the measured response (total number of laps), rmin is the minimum response measured across all stimuli (including control), rmax is the maximum response measured across all stimuli and rn is the normalized response scaled from 0 (minimum response) to 1 (maximum response).
We compared optomotor responses to varying stripe widths among 5 taxonomic categories of fish: (1) four mormyrid species in clade A, which all have ELa/ELp; (2) P. microphthalmus, which also has ELa/ELp; (3) four other petrocephaline species, which all have EL; (4) two species in the outgroup family Notopteridae, and (5) one species in the outgroup family Pantodontidae (fig. 7). Optomotor responses increased significantly with increasing stripe width (repeated-measures ANOVA: F7,679 = 56.1, p < 0.000001). There was also a significant interaction effect between stripe width and taxonomic group (repeated-measures ANOVA: F28,679 = 3.0, p < 0.000001), reflecting differences between groups in the relationship between stripe width and response. A significant interaction effect remained after removing the two taxonomic outgroups and comparing just the three groups of mormyrids (repeated-measures ANOVA: F14,539 = 3.2, p < 0.0001), verifying that visual acuity differs among mormyrid taxa.

Petrocephaline mormyrids with enlarged visual systems have greater visual acuity than other osteoglossomorph fishes. Plots of the normalized number of laps (mean ± s.e.m.) as a function of stripe width are shown for 5 taxonomic groups. Dotted lines indicate mean normalized number of laps in response to 50% gray control stimulus. For each group, arrowheads point to the smallest stripe width that elicited a normalized response >0.5, which we used as an operational measure of threshold. Petrocephalines with a small EL and large OT had the smallest thresholds (highest visual acuity). Clade A mormyrids, which have an enlarged ELa/ELp and small OT, had the largest thresholds (lowest visual acuity).
Petrocephaline mormyrids with enlarged visual systems have greater visual acuity than other osteoglossomorph fishes. Plots of the normalized number of laps (mean ± s.e.m.) as a function of stripe width are shown for 5 taxonomic groups. Dotted lines indicate mean normalized number of laps in response to 50% gray control stimulus. For each group, arrowheads point to the smallest stripe width that elicited a normalized response >0.5, which we used as an operational measure of threshold. Petrocephalines with a small EL and large OT had the smallest thresholds (highest visual acuity). Clade A mormyrids, which have an enlarged ELa/ELp and small OT, had the largest thresholds (lowest visual acuity).
For each taxonomic group, we used an operational definition of threshold as the smallest stripe width tested that resulted in a normalized response >0.5 (arrowheads in fig. 7). By this measure, petrocephalines with an EL had the smallest threshold (0.8 cm), clade A mormyrids had the largest threshold (2.7 cm) and P. microphthalmus and the two outgroups had intermediate thresholds (1.6 cm). Finally, to directly relate visual sensitivity to electrosensory phenotype, we compared the optomotor responses of three groups of fishes: (1) mormyrids with an ELa/ELp; (2) petrocephalines with an EL, and (3) outgroup species (fig. 8). As in the original analysis, there was a significant effect of stripe width (repeated-measures ANOVA: F7,693 = 63.9, p < 0.000001) as well as a significant interaction effect between stripe width and group (repeated-measures ANOVA: F14,693 = 5.0, p < 0.000001). These results indicate that petrocephalines with an EL have enhanced visual acuity, whereas mormyrids with an ELa/ELp have reduced visual acuity compared to outgroup species.

Visual acuity is greatest in mormyrids with a large visual system and small electrosensory system and lowest in mormyrids with a small visual system and large electrosensory system. Plots of the normalized number of laps (mean ± s.e.m.) as a function of stripe width are shown for 3 groups: mormyrids with a large OT and small EL, mormyrids with a small OT and large EL and outgroup species.
Visual acuity is greatest in mormyrids with a large visual system and small electrosensory system and lowest in mormyrids with a small visual system and large electrosensory system. Plots of the normalized number of laps (mean ± s.e.m.) as a function of stripe width are shown for 3 groups: mormyrids with a large OT and small EL, mormyrids with a small OT and large EL and outgroup species.
Discussion
We found that a single lineage of mormyrid electric fishes within the subfamily Petrocephalinae has a larger visual system and better visual acuity compared to other mormyrid lineages. All other mormyrids studied, including all species in the subfamily Mormyrinae and the petrocephaline P. microphthalmus, have relatively small eyes and small OTs. The most parsimonious interpretation of these data suggests that a relatively small visual system was the ancestral mormyrid character state, and that an enlarged visual system evolved just once in a single mormyrid lineage. This interpretation is strengthened by the observation that G. niloticus, the sister taxon to all mormyrids, has greatly reduced eyes. Thus, it would appear that the evolution of active electrosensing and electrocommunication in the Mormyroidea was correlated with a reduction in the size of the visual system (fig. 1). Previous phylogenetic analysis of evolutionary change in the knollenorgan electrosensory system suggests that EL was the ancestral mormyrid character state, and that ELa/ELp evolved twice independently, once in the mormyrine clade A and once in the petrocephaline P. microphthalmus [Carlson et al., 2011]. Thus, subsequent to the evolutionary innovation of an active electrosense, two lineages evolved enlarged knollenorgan electrosensory systems (clade A and P. microphthalmus) and one lineage evolved an enlarged visual system (the petrocephalines having an EL).
OT size, lamination and cell types vary widely across vertebrates [Northcutt, 2002]. Our results show that the OT can vary in size even between closely related species (fig. 2, 3, 4). Eye size and OT size were highly correlated across species (fig. 4a). Our phylogenetic analysis revealed that this correlation was not simply due to shared ancestry of these two traits, suggesting a functional link between covariation in eye size and OT size. Our behavioral tests suggest that improved visual acuity is one functional consequence of the enlarged petrocephaline visual system (fig. 7, 8). This observation fits well-established theoretical considerations and experimental evidence from a wide range of taxa [Walls, 1942; Hughes, 1977; Land and Nilsson, 2002]. All else being equal, larger eyes result in a larger retinal projection and a greater number of photoreceptors sampling an image, leading to increased visual acuity. Similarly, a larger OT likely reflects a greater number of neurons sampling visual space [Northcutt, 2002]. The enlarged petrocephaline visual system likely confers additional benefits. For example, larger eyes can establish increased visual sensitivity because they collect more light [Walls, 1942; Hughes, 1977; Land and Nilsson, 2002].
Retinal morphology has been studied in detail in the clade A mormyrid G. petersii, revealing a specialized ‘grouped retina' in which large numbers of cone photoreceptors are housed together inside reflective crystalline cups [Landsberger et al., 2008; Kreysing et al., 2012]. This kind of reflective surface, or tapetum lucidum, is generally associated with increased visual sensitivity as it allows for more photons to be absorbed by photoreceptors. However, such reflective surfaces are typically located at the back of the retina rather than among the photoreceptors. In addition, rod photoreceptors are located behind these cups, revealing that the reflective surface is not a simple adaptation for increasing visual sensitivity in low-light conditions. Instead, this retinal morphology assists in dim light vision both by increasing photon capture and by creating a spatial low-pass filter of visual input, thus reducing visual acuity but improving the detection of large, looming stimuli such as predators in the presence of spatial noise [Kreysing et al., 2012]. The grouped retina of G. petersii is also associated with relatively high temporal resolution and sensitivity to low contrast, both of which likely contribute further to predator detection and avoidance [Pusch et al., 2013].
Our findings suggest that comparative study of retinal morphology in petrocephalines with enlarged visual systems may reveal new insights into the evolution of vertebrate retinas. Their larger eyes and larger OTs suggest that their improved visual acuity is related to an increased number of photoreceptors and an associated reduction in receptive field size. However, we do not yet know if they have the same kind of grouped retina as G. petersii. Given that a grouped retina reduces spatial resolution [Schuster and Amtsfeld, 2002], the increased visual acuity of petrocephalines suggests either that they do not have the same kind of grouped retina or that they have evolved additional specializations for improving the spatial resolution of a grouped retina. Currently, nothing is known about the phylogenetic distribution and evolutionary history of the grouped retina reported for G. petersii.
Although our data support the long-standing idea of decreased visual function associated with the evolutionary origins of active electrosensing [Lazar et al., 1984; Wullimann and Northcutt, 1990; Moller, 1995; Kramer, 1996], they reveal no direct trade-offs in the evolution of visual and electrosensory systems among mormyrids. Our phylogenetic analysis revealed that shared electrosensory-visual phenotypes were the result of common ancestry rather than correlated evolutionary change between these two traits (fig. 4b). Certain lineages of mormyrids evolved enlarged visual or electrosensory systems, but these were not associated with concomitant decreases in electrosensory or visual systems, respectively.
However, it is important to emphasize that our study of the electrosensory system was limited to the sensory pathway dedicated to processing electric communication signals [Xu-Friedman and Hopkins, 1999; Baker et al., 2013]. Separate electroreceptors and central sensory pathways serve passive and active electrolocation [Bell and Maler, 2005; Kawasaki, 2005], and it remains to be seen whether evolutionary change in the visual system among mormyrids is correlated with evolutionary change in these systems. Comparative analysis of these additional electrosensory systems as well as other sensory systems may reveal further interesting evolutionary specializations. For example, Myomyrus spp. have neither enlarged knollenorgan electrosensory systems nor enlarged visual systems, and they may have other, as of yet unknown sensory specializations. Mormyrids are generally considered to be auditory specialists because they have a gas-filled tympanic bladder located next to the auditory bulla that enables acoustic pressure sensitivity [McCormick and Popper, 1984; Yan and Curtsinger, 2000; Fletcher and Crawford, 2001]. However, auditory sensitivity has been studied in just a small number of mormyrid species.
Mormyrids with an ELa/ELp use temporal features of the electric signal pulse waveform for species recognition and mate choice [Hopkins and Bass, 1981; Arnegard et al., 2006; Machnik and Kramer, 2008; Feulner et al., 2009]. However, mormyrids with an EL are unable to recognize changes in pulse waveform [Carlson et al., 2011], and they may use other characteristics of electric signals such as frequency spectrum or interpulse-interval patterns for species recognition and mate choice [Carlson and Arnegard, 2011]. Our findings raise the possibility that petrocephalines with an EL may use visual information in their social behavior. Petrocephaline species are often described as having iridescent, reflective skin with black spots that differ in number, size and location among species [Harder, 2000; Lavoué et al., 2008a, 2010]. These distinctive pigmentation patterns could mediate species recognition. Previous work has suggested that even clade A species may use vision to assist with species recognition under certain conditions [Moller et al., 1982; Moller and Serrier, 1986]. Both electrical and acoustic communication play important roles in the social behavior of the clade A Pollimyrus spp. [Crawford et al., 1986; Bratton and Kramer, 1989; Crawford, 1997; Crawford et al., 1997]. Overall, the available evidence suggests that mormyrids integrate multiple sensory cues not only in their social behavior, but also in a variety of other behavioral contexts [Moller et al., 1982; Moller and Serrier, 1986; Moller, 2002; Rojas and Moller, 2002; Pluta and Kawasaki, 2008]. Given our observation of extensive evolutionary change in at least two sensory systems, future comparative studies on multisensory integration in the context of social behavior across mormyrids should prove especially interesting.
Although there is no direct trade-off between visual and electrosensory systems among mormyrids, it is interesting that different mormyrid lineages have specialized in different sensory systems, with no lineage specializing in both. Maintaining sensory receptors and central sensory neurons entails significant energetic requirements, and this has played an important role in sensory system evolution [Niven and Laughlin, 2008]. These energetic costs may limit both the number and extent of sensory specializations. Furthermore, enlarged or elaborated sensory systems can only evolve if they provide benefits that offset these costs. Thus, the evolution of visual or electrosensory specializations in different mormyrid lineages suggests major ecological differences that have favored improvements in different sensory abilities. Such ecological differences have likely shaped divergence in behavior and life history as well. Unfortunately, detailed comparative data on the ecology and life history of mormyrids are lacking [for a review of basic mormyrid ecology, see Moller, 1995]. Although social behavior has been studied in several clade A species [see reviews by Hopkins, 1986; Kramer, 1990; Moller, 1995; Kramer, 1996; Carlson, 2002], there are relatively few studies on the social behavior of petrocephalines [Scheffel and Kramer, 2000; Lamml and Kramer, 2008], and, to our knowledge, no studies of behavior in Myomyrus spp. Comparative research into mormyrid ecology, life history and social behavior will prove deeply informative in developing an integrated understanding of sensory system evolution that relates ecological adaptation to evolutionary change in sensory perception and how this has impacted behavioral diversification.
Acknowledgements
We thank J.P. Friel of the Cornell University Museum of Vertebrates for providing the specimens used for brain histology, S.M. Hasan and D.B. Miller for providing sectioned brains, S. Lavoué and J.P. Sullivan for providing cytb sequences, R. Afene, M.E. Arnegard, R.N. Eleyson, M.F. Eva, J.R. Gallant, J.D. Mbega, J.P. Sullivan and B.N. Zefiré for help with collecting fish in the field, S. Lavoué for providing the fish outlines used in the figures and A. Larson for providing helpful feedback on phylogenetic comparative methods and interpretation. This work was supported by a grant from the National Science Foundation (IOS-0818390 to B. A. Carlson).
