

Abstract
Background: Cigarette smoke extract (CSE), a model for studying the effects of tobacco smoke in vivo and in vitro, induces cell oxidative stress and affects the antioxidative glutathione system. We evaluated the impact of CSE on airway epithelial cells and the possible cytoprotective effect of the mucolitic drug S-carboximethilcysteine lysine salt (S-CMC-Lys). Methods: Reduced glutathione (GSH) and reactive oxygen species (ROS) intracellular levels were evaluated by fluorimetry in human bronchial epithelial cells (16-HBE) and the expression and activity of enzymes of the GSH metabolic pathway were investigated by RT-PCR, Western blot and colorimetric assays. Results: CSE significantly increased cell mortality in a time and dose dependent manner, via an apoptosis-independent pathway. Short-term (3 hours) CSE exposure induced an increase in ROS levels and a GSH intracellular concentration drop. In parallel, the expression of glutathione peroxidases 2 and 3, glutathione reductase and glutamate-cysteine-ligase was increased. S-CMC-Lys was effective in counteracting these effects. Conclusion: CSE affects ROS levels, GSH concentration and GSH enzymes pathway. These effects can be to some extent reversed by S-CMC-Lys, that could represent a therapeutic tool to counteract CSE induced oxidative cellular injuries.
Introduction
Cigarette smoking related pulmonary diseases, such as chronic obstructive pulmonary disease (COPD) and cancer, are the leading cause of mortality and morbidity in the worldwide population [1,2]. Cigarette smoke is a complex mixture of chemical compounds, most of which are known toxicants and carcinogens [3], and contains high concentrations of free radicals and oxidants [4]. It thus induces an oxidative stress to the lungs as well as to the entire organism [5], contributing to an irreversible structural damage of both parenchyma and airway walls [6]. Alveolar macrophages are stimulated by cigarette smoke oxidants to produce further reactive oxygen species (ROS) and to release pro-inflammatory mediators, some of which attract neutrophils and other inflammatory cells into the lungs [7]. As a consequence, lipid peroxidation products and pro-inflammatory cytokines increase and the antioxidative capability of lung cells is reduced. Accordingly, ROS induced by cigarette smoke extract (CSE) have been shown to induce gene expression of inflammatory mediators, such as IL-1 and TNF- α, in alveolar macrophages and bronchial epithelial cells, which in turn can trigger airway epithelial cells to activate pro-inflammatory genes, such as tumor necrosis factor-α (TNF-α), interleukin-8 (IL-8), interleukin-1 (IL-1), inducible nitric oxide synthase (iNOS), cyclooxygenase-2 (COX-2), intercellular adhesion molecule-1 (ICAM-1), vascular cell adhesion molecule-1 (VCAM-1), interleukin-6 (IL-6), matrix metallopeptidase-9 (MMP-9), macrophage inflammatory proteins-1α (MIP-1α), granulocyte-macrophage colony stimulating factor (GM-CSF), stress response genes and antioxidative enzyme genes [8]. Moreover, exposure to cigarette smoke has also been reported to cause a decrease in the reduced glutathione (GSH) concentration [9] and in the expression or activity of several antioxidant enzymes such as glutathione peroxidase (GPx), superoxide dismutase (SoD) and catalase.
GSH can be found throughout the body and is involved not only in maintaining the cytosolic redox potential, but also in many other cellular processes including protein and nucleic acid synthesis, regulation of cell cycle, proliferation, exocrine secretion and thermotolerance [10]. It can react with a wide range of molecules, making it an effective antioxidant and an important detoxifying agent of many reactive electrophilic components of cigarette smoke. In most cells, the cytosolic concentration of glutathione is in the range of 1-10 mM (>98% in thiol-reduced form). Micromolar glutathione concentrations are found in the plasma [11], whereas it is concentrated in the lung epithelial lining fluid (ELF) 10-100 times more than in the plasma [12].
The biosynthesis of GSH occurs intracellularly and results from the concerted efforts of two ATP-dependent enzymes: the glutamate-cysteine-ligase (GCL) and the glutathione synthase (GS), whereas it is degraded exclusively outside the cells via cleavage by the ectoenzymes γ-glutamyl transpeptidase and dipeptidase [13]. GCL is the rate limiting enzyme involved in GSH synthesis and its expression has been shown to be induced in response to cigarette smoke [14]. GSH intracellular levels are highly regulated also by controlling its export from the cells. Some of the proteins responsible for GSH export from mammalian cells have recently been identified [15,16,17], and there is increasing evidence that these GSH exporters are multispecific and multifunctional, regulating a number of key biological processes. GSH extrusion has been reported to be induced or enhanced by a variety of stimuli including hyposmotic stress [18], and the involvement of anionic channels such as CFTR [16] or swelling activated channels in GSH release has been demonstrated [19]. GSH intracellular levels are also influenced by the mucolytic drugs N-acetylcysteine and S-carboximethilcysteine, Lysine salt (S-CMC-Lys). S-CMC-Lys can act both by stimulating GSH efflux [16] and by increasing GSH cellular concentration, while reducing ROS intracellular levels in airway epithelial cells [15], thus having a possible cytoprotective effect [15,16,20].
In airway epithelial cells, GSH plays a critical role for the defence from oxidants and inflammatory injury [8]. Accordingly, alterations in alveolar and lung GSH metabolism are a central feature of many inflammatory lung diseases. A decrease in the levels of GSH in the lung lining fluid has been displayed in idiopathic pulmonary fibrosis, acute respiratory distress syndrome, cystic fibrosis, and human immunodeficiency virus positive patients [21], where acetylcysteine drugs have been therapeutically employed, even if with conflicting results [22]. In contrast, an increase in total glutathione concentration (the sum of reduced (GSH) and oxidized (GSSG) glutathione) has been reported in the bronchial and alveolar fluid of patients with mild asthma [23].
A prolonged exposure to CSE (a model system for studying tobacco smoke effects in vitro and in vivo) can affect the expression of several enzymes and transcription factors, leading to an increased synthesis of GSH [24]. This increase is referred to as GSH adaptive response. An unclear and sometimes ambiguous picture has been given about the effects of CSE on the GSH adaptive response and about how GSH levels can fluctuate both during and between CSE exposures [25]. The purpose of this study was to determine the effects, in airway epithelial cells (16-HBE), of CSE on GSH intracellular levels and metabolism, that are involved in counteracting and managing the oxidant burden observed in several airway pathologies such as asthma and COPD. A further aim of this paper was to evaluate a possible cytoprotective role of S-CMC-Lys against CSE induced effects, in order to further characterize the drug mechanism of action and its possible applications in several lung pathologies related to smoke exposure or oxidative stress.
Materials and Methods
Cell line and solutions for cell maintenance
16-HBE 14o- (16-HBE) cells, an immortalised human bronchial epithelial cell line, were grown in collagen/fibronectin coated plates with Eagle's Minimum Essential Medium (EMEM, Sigma, Italy) supplemented with 10% Fetal Bovine Serum (FBS), 2 mM L-glutamine, 0.1 mM non essential aminoacids, 100 U/ml penicillin, 100 μg/ml streptomycin (Sigma, Italy). Cell cultures were maintained at 37°C with 5% CO2 and passaged every 3-4 days.
16-HBE cells were cultured in the presence or absence of S-CMC-Lys (Dompé, Milan, Italy) and in the presence or absence of different concentrations of CSE for 3 or 24 hours.
S-CMC-Lys (100 μM) [15] was added to the medium and cells were incubated for 1 hour.
Preparation of CSE Solutions
CSE was prepared immediately before use as described by Su et al. [26] with some modifications. After the removal of the filter, three cigarettes (Marlboro, Philip Morris, Inc., Richmond,VA, containing 10 mg of tar and 0,8 mg of nicotine) were bubbled into 30 ml of phosphate-buffered saline (PBS, 136.9 mM NaCl, 2.7 mM KCl, 3.2 mM Na2HPO4, 1.5 mM KH2PO4). The CSE solution was filtered through a syringe with a 0.45 μm pore size filter to remove bacteria and particulate.
The concentration of CSE was calculated spectrophotometrically by measuring the optical density at a wavelength of 320 nm. This solution was considered to be 100% CSE and was diluted to the concentrations of 2.5, 5 and 10%, keeping the PBS/EMEM proportion fixed to 1:10. Controls were made by adding PBS to the medium (1:10). The CSE concentrations used correspond approximately to exposures associated with smoking slightly less than 0.5 pack cigarettes/day (2.5%) to slightly less than 2 packs per day (10%) [26].
MTT Assay
16-HBE cells were seeded 104 cells/well in a 96 multiwell plate and, after 24 hours, exposed to different concentrations of CSE (2.5%, 5% and 10%). After 3 or 24 hours the incubation medium was substituted with 3-[4,5-dimethylthiazol-2-yl]-2,5-diphenyltetrazoliumbromide (MTT) 50 µg/ml in complete growth medium. After an incubation at 37°C for 2 hours, the MTT solution was removed and cells were lysed in 90% DMSO/ 10% Sorensen's glycine buffer (0.1 M Glycin, 0.1 M NaCl, pH 10.5). Absorbance (A) was measured at 570 nm with an Infinite™ 200 Pro multi plate reader (Tecan Group Ltd., Mannedorf, CH). Values were subtracted of the A values readings at 630 nm. Six independent complete series (each comprising control, 2.5%, 5%, 10% CSE) were assayed. In each series, every condition was measured in triplicate.
Cell counting and trypan blue exclusion test
16-HBE cells were seeded 5*103 cells/well in a 96 multiwell plate and, after 24 hours, exposed to different concentrations of CSE (2.5%, 5% and 10%). At each experimental time (3 hours and 24 hours) cells were trypsinized. Cells from four wells were pooled for each condition, centrifuged and resuspended in culture medium. The total number of adherent cells was determined by means of a Burker chamber. Cell mortality was evaluated in the presence of trypan blue (0.2%) staining, with an inverted phase contrast microscope. Three (24 hours) or four (3 hours) independent series were performed; in each series all conditions (control, 2.5%, 5%, 10% CSE) were tested.
Apoptosis assay
16-HBE cells were seeded 5*104 cells/well in a 96 multiwell plate and, after 24 hours, exposed to different concentrations of CSE (2.5%, 5% and 10%). APOPercentage Apoptosis Assay (Biocolor, Northern Ireland) was used to quantify apoptosis, according to manufacturer instructions. This assay is based on the staining of the apoptotic cells undergoing the cellular membrane flip-flop event when phosphatidylserine is translocated to the outer leaflet. Phosphatidylserine transmembrane movement results in uptake of APOPercentage dye (Biocolor Ltd) by apoptotic-committed cells. After the exposure for 24 hours to PBS (control) or CSE 5%, cells were treated with 5% of the APOPercentage dye. Treated cells were incubated for 30 minutes, then washed twice with PBS to remove excess dye, and Release reagent was added. Quantitative analysis was performed using a colorimetric assay following the release of dye from apoptotic cells. Two completely independent series were performed; each refers to the mean of three wells.
Evaluation of intracellular GSH
1.1*105 cells were seeded in a glass bottomed 3 cm diameter Petri dish. After 24 hours cells were treated with PBS (control) or CSE or CSE and S-CMC-Lys. Changes of intracellular GSH concentrations were evaluated using the dye monochlorobimane (MCB, Invitrogen s.r.l., Italy), as previously reported [15], with some modifications. Cells were incubated at 37°C for 20 minutes with 60 μm MCB dissolved in Dulbecco's phosphate-buffered saline (D-PBS: 0.9 mM CaCl2, 0.5 mM MgCl2, 2.67 mM KCl, 1.5 mM KH2PO4, 8.1 mM Na2HPO4, 138 mM NaCl) supplemented with 4.5 g/l glucose, washed twice gently with warm D-PBS + glucose, placed in D-PBS + glucose and immediately used for measurements. Fluorescence imaging experiments were performed at room temperature and images were acquired with an inverted fluorescence microscope (Axiovert 200, Zeiss, equipped with an EXFO X-CITE 120 fluorescence illuminator and an AxioCam HRm camera), with a 20x objective. Images were analyzed with the ImageJ (NIH, USA) software. Values represent the average of the mean fluorescence intensity measured in randomly distributed fields (each field represented a region of interest, ROI) selected in independent Petri dishes (five ROIs for each Petri dish). All ROIs were of the same size and data were collected in two or more experimental days. In each experimental day all conditions (control, CSE, CSE and S-CMC-Lys) were assayed. ROIs always included several cells and only adherent cells were considered in the analysis.
Evaluation of intracellular ROS
Intracellular ROS accumulation was monitored with the fluoroprobe 5-(and 6)-chloromethyl-2',7'-dichlorodihydrofluorescein-diacetate, acetyl ester (CM-H2DCF-DA, Invitrogen s.r.l., San Giuliano Milanese, Italy), as previously reported [15], with some modifications. 1.1*105 cells were seeded in a glass bottomed 3 cm diameter Petri dish. After 24 hours cells were treated with PBS (control) or CSE or CSE and S-CMC-Lys. After 20 minutes of incubation at 37°C with 3.5 μM CM-H2DCF-DA dissolved in D-PBS + glucose, cells were rinsed twice with warm D-PBS + glucose and kept in D-PBS + glucose at 37°C for 10 minutes before the beginning of the experiment.
Fluorescence imaging experiments were performed at room temperature and images were acquired with an inverted fluorescence microscope (Axiovert 200, Zeiss, equipped with an EXFO X-CITE 120 fluorescence illuminator and an AxioCam HRm camera), with a 20x objective. Images were analyzed with the ImageJ software. Values represent the average of the mean fluorescence intensity measured in randomly distributed fields (each field represented a ROI) selected in independent Petri dishes (five ROIs for each Petri dish), prepared in three experimental days. In each experimental day all conditions (control, CSE, CSE and S-CMC-Lys) were assayed. ROIs were all of the same size and always included several cells. Only adherent cells were considered in the analysis.
Western Blot
For total protein extraction, confluent layers of cells from 10 cm diameter Petri dishes were lysed in Tris lysis buffer (20 mM Tris-HCl, 150 mM NaCl, 1 mM EDTA, 1% NP40, Complete EDTA-free Protease Inhibitor Cocktail (Roche Diagnostics), pH 7) and snap-frozen in liquid nitrogen. The lysate was spinned at 4500 g for 5 minutes and the supernatant saved and stored at -80°C until use. Protein concentration was quantified by the Bradford assay. All protein extracts were heated at 99°C for 5 minutes in SDS-PAGE solubilizing buffer (57.85 mM Tris HCl, 10% Glycerol, 2% SDS, 0.004% Bromophenol blue, pH 6.8) containing 7.5% Dithiothreitol. Proteins were separated by SDS-PAGE-electrophoresis on a 10% polyacrylamide gel and transferred onto a nitrocellulose membrane (Biorad). After blocking with 5% milk powder in TBST (15 mM Tris-HCl, 150 mM NaCl, 0.1% Tween20, pH 7.5) the membrane was incubated at 4°C overnight with one of the following antibodies: anti-GCL modulatory subunit (anti-GCLM; purified MaxPab mouse polyclonal antibody (B01P), D.B.A., Italy), monoclonal anti-GCL catalytic subunit (anti-GCLC; clone 3HI, D.B.A. Italy), monoclonal anti-Glyceraldehyde 3-phosphate dehydrogenase (anti-GAPDH; clone GAPDH-71.1, Sigma-Aldrich), anti-Tubulin clone DM1A 05-829 (Millipore, Italy) diluted in the blocking buffer, followed, after several washing steps, by the secondary horseradish peroxidase (HRP)-conjugated antibody. Detection was performed with the Immobilon ECL system (Millipore S.p.A., Italy).
The nitrocellulose membrane was always stained with 0.1% (w/v) Ponceau in 5% acetic acid to assess the efficiency of protein transfer and check for equal loading. The densitometric analyses of the bands were performed with the ImageJ software.
Real-time quantitative PCR (qPCR)
Total RNA was isolated from subconfluent (∼90%) cells seeded in 10 cm diameter Petri dishes, by using a Qiagen RNeasy Protect Mini kit (Quiagen, Italy) according to manufacturer instructions. Total RNA concentration was spectrofotometrically quantified, and structural integrity of the RNA samples was confirmed by electrophoresis in 1% Tris-borate-EDTA (TBE)-agarose gels. After digestion with DNAse I (Sigma-Aldrich, Italy), 2 µg of mRNA were retro-transcribed to cDNA via reverse transcriptase Impromm II (Promega, Italy). Real-time qPCR assays were performed in a 25 μl reaction volume containing 12.5 μl 2× SYBR Green I PCR Master Mix (Applied Biosystems, USA), 10 (actin) or 50 ng (all the other genes) cDNA, 10 µM forward and reverse primers.
Reactions were performed in 96-well µultraAmp PCR Plates - FastPlate96 (Sorenson) using the ABI Prism 7900 high-throughput sequence detection systems (Applied Biosystems) and data were processed by the associated SDS software version 2.3 (Applied Biosystems).
For each gene an amplification curve was made to evaluate the amplification efficiency. The sequences of forward and reverse primers are: β-actine (ACT) forward primer 5'-gatgacccagatcatgtttgagacc-3' and reverse primer 5'-accactggcatcgtgatggact-3'; GCLM forward primer 5'-ggcacaggtaaaaccaaatagtaac-3' and reverse primer 5'-caaattgtttagcaaatgcagtca-3'; GCLC forward primer 5'-acaccctcatgagcatagacacca-3' and reverse primer 5'-aactccctcatccatctggcaact-3'; glutathione peroxidase 1 (GPx1) forward primer 5'-cgcaacgatgttgcctggaacttt-3' and reverse primer 5'-aggctcgatgtcaatggtctggaa-3'; glutathione peroxidase 2 (GPx2) forward primer 5'-taagtgggctcaggcctctct-3' and reverse primer 5'-ggtcatagaaggacttggcaatg-3'; glutathione peroxidase 3 (GPx3) forward primer 5'-gacaagagaagtcgaagatg-3' and reverse primer 5'-cttcctgtagtgcattcagtt-3'; glutathione reductase (GR) forward primer 5'-aacatcccaactgtggtcttcagc-3' and reverse primer 5'-ttggtaactgcgtgatacatcggg-3'.
After each PCR, a melting curve was always made, to check for specificity of PCR.
Measurement of GPx activity
GPx activity was measured by using a commercial glutathione peroxidase assay kit (Cayman), accordingly to manufacturer's instructions. Subconfluent (∼70%) cells, seeded in 6 cm diameter Petri dishes, were treated for 24 hours with PBS (control), CSE, or CSE and S-CMC-Lys. Cells were scraped, collected, resuspended in cold 50 mM potassium phosphate (pH 7.5, 1 mM EDTA) and snap-frozen twice in liquid nitrogen. Samples were then centrifuged at 10000 g for 15 minutes at 4°C and the supernatants were removed for analyses. Protein concentration was quantified by the Bradford method. 70 µg total proteins were added to a solution containing GPx Assay Buffer (50mM tris-HCl, 5 mM EDTA, pH 7.6) and co-substrate mixture (containing reduced nicotinamide adenine dinucleotide phosphate (NADPH), glutathione, and glutathione reductase).
The reaction was initiated by adding the substrate cumene hydroperoxide, and the optical density (OD) was recorded at 340 nm (OD340) using the kinetic program (6 readings at 1-minutes intervals) of the Infinite™ 200 Pro multi plate reader (Tecan Group Ltd., Mannedorf, CH). The GPx activity was determined by the rate of decrease in OD340, with blank subtraction. Values were normalized for the mean total number of cells measured in each condition in different wells. Three independent complete series (each comprising control, CSE, or CSE and S-CMC-Lys) were assayed. In each series, every condition was measured in triplicate.
Statistics
Data are presented as mean ± S.E.M. Differences between two groups were assessed using two-tailed Student's t-test and differences amongst three or more groups with one-way ANOVA with Dunnet's post-hoc test. Tests have been performed by the Graph Pad 5 software (graph PAD, San Diego, Calif.). Differences between groups were considered statistically significant when at least a 95% confidence level (p<0.05) was obtained.
Results
CSE affects 16-HBE cell viability
16-HBE cells have been exposed to 2.5%, 5%, and 10% CSE for 3 or 24 hours, and cell viability has been evaluated by trypan blue exclusion test. Dye exclusion is a simple method to evaluate cell viability but it is subject to the problem that viability is being determined indirectly from cell membrane integrity. Thus, it is possible that cell viability (referred to the capacity to grow or function) may have been compromised even though membrane integrity is (at least initially) maintained. Therefore we performed MTT test in the same condition to gain further information on cell proliferation.
Cells were not significantly affected in terms of mortality and proliferation after a 3 hours exposure to the concentrations tested (Fig. 1A, B, C). After a prolonged (24 hours) exposure (Fig. 1D, E, F), CSE affected cell viability in a dose dependent manner. The effect on cell mortality with a 10% CSE treatment was significantly different both from the relative control and from what observed after a 3 hours 10% CSE exposure (3 hours 10% CSE: 3.80 ± 1.00%, n=4; 24 hours 10% CSE: 71.26 ± 18.76 %, n=4, p<0.05, t-test). The MTT assay (Fig. 1F) showed that at 24 hours a CSE exposure as low as 5% was enough to significantly reduce cell proliferation, even if mortality was not significantly different from the control condition. This suggests that even though membrane integrity was maintained, the CSE constituents were able to negatively affect cell metabolic activity. The impact of CSE on the total number of cells (Fig. 1A, D), was similar to that observed with the MTT assay (Fig. 1C, F), with statistical differences (t-test, p<0.05) only for the 24 hours exposure and in the case of 5% and 10% CSE (5% CSE: 50.7 ± 14.1%, 10% CSE: 22.2 ± 8.2%, vs control: 100.0 ± 3.9%, n=4).

16-HBE cell viability in the presence of increasing concentrations of CSE (2.5%, 5%, and 10%). A) total number of cells, expressed as a percentage to control, after 3 hours of exposure to CSE (n=4); B) cell mortality, evalueted by the trypan blue exclusion test, expressed as dead cells in percentage of total cells, after 3 hours of exposure to CSE (n=4); C) cell proliferation evaluated by the MTT test after 3 hours of exposure to CSE (n = 6); D) total number of adherent cells, expressed as a percentage of control, after 24 hours of exposure to CSE (n=4); E) cell mortality, evaluated by the trypan blue exclusion test and expressed as dead cells in percentage of total cells, after 24 hours of exposure to CSE (n=3); F) cell proliferation evaluated by the MTT test after 24 hours of exposure to CSE (n=6). ** = p < 0.01, * = p < 0.05 with one-way Anova statistical analysis. #=p<0.05 with t-test.
16-HBE cell viability in the presence of increasing concentrations of CSE (2.5%, 5%, and 10%). A) total number of cells, expressed as a percentage to control, after 3 hours of exposure to CSE (n=4); B) cell mortality, evalueted by the trypan blue exclusion test, expressed as dead cells in percentage of total cells, after 3 hours of exposure to CSE (n=4); C) cell proliferation evaluated by the MTT test after 3 hours of exposure to CSE (n = 6); D) total number of adherent cells, expressed as a percentage of control, after 24 hours of exposure to CSE (n=4); E) cell mortality, evaluated by the trypan blue exclusion test and expressed as dead cells in percentage of total cells, after 24 hours of exposure to CSE (n=3); F) cell proliferation evaluated by the MTT test after 24 hours of exposure to CSE (n=6). ** = p < 0.01, * = p < 0.05 with one-way Anova statistical analysis. #=p<0.05 with t-test.
Using a cell apoptosis detection kit (APOPercentage™ assay), the induction of apoptosis by a prolonged treatment (24 hours) of CSE was evaluated. This colorimetric assay allows to evaluate the expression of phosphatidylserine on the outer surface of the cell membrane, one of the early events of apoptosis. We did not find any significant optical density variation between control (100.0 ± 5.3%, n=10) and CSE treated cells (107.2 ± 3.2%, n=10), indicating that the increased mortality observed in the presence of CSE was not due to an apoptotic process.
CSE effects on intracellular GSH and ROS
One of the consequences of the oxidative stress induced by cigarette smoke is the generation of ROS that mediates the cell injury. Since the effects elicited by CSE on 16-HBE cell viability and metabolism appear to be concentration and time dependent, we investigated the effect of 2.5% and 5% CSE at 3 hours or 24 hours of treatment on the intracellular level of GSH. In the case of short-term exposures, both 2.5% CSE and 5% CSE (Fig. 2B, C) caused a significant reduction of intracellular GSH (2.5% CSE: -25.68±3.66 % of control, n=25; 5%CSE: -43.53±3.07 % of control, n=25), with the effect of CSE 5% being significantly more intense (p<0.01).

CSE effect on intracellular GSH levels in 16-HBE cells. Examples of fluorescence microscopy original images. Each image represents a ROI (region of interest). Graphs represent the average of the mean fluorescence intensity measured in all ROIs, expressed as percentage of control condition (reported as %F compared to control (GSH intracellular levels) in the graphs) recorded in cells exposed to A) PBS (CTRL: control) and 100 µM S-CMC-Lys (CMC) for 3 hours (n=30); B) PBS (CRTL: control), 2.5% CSE, 2.5%CSE and 100 µM S-CMC-Lys (CSE + CMC) for 3 hours (n=25); C) PBS (CRTL: control), 5% CSE, 5%CSE and S-CMC-Lys (CSE + CMC) for 3 hours (n=25), D) PBS (CRTL: control), 5% CSE, 5% CSE and S-CMC-Lys (CSE + CMC) for 24 hours (n =60); n is the number of ROIs. Scale bar = 100 µm. ** = p < 0.01 * = p < 0.05 with one-way Anova statistical analysis.
CSE effect on intracellular GSH levels in 16-HBE cells. Examples of fluorescence microscopy original images. Each image represents a ROI (region of interest). Graphs represent the average of the mean fluorescence intensity measured in all ROIs, expressed as percentage of control condition (reported as %F compared to control (GSH intracellular levels) in the graphs) recorded in cells exposed to A) PBS (CTRL: control) and 100 µM S-CMC-Lys (CMC) for 3 hours (n=30); B) PBS (CRTL: control), 2.5% CSE, 2.5%CSE and 100 µM S-CMC-Lys (CSE + CMC) for 3 hours (n=25); C) PBS (CRTL: control), 5% CSE, 5%CSE and S-CMC-Lys (CSE + CMC) for 3 hours (n=25), D) PBS (CRTL: control), 5% CSE, 5% CSE and S-CMC-Lys (CSE + CMC) for 24 hours (n =60); n is the number of ROIs. Scale bar = 100 µm. ** = p < 0.01 * = p < 0.05 with one-way Anova statistical analysis.
S-CMC-Lys has been shown to have a protective role against oxidative stress in other cell lines [15,20]. To ascertain its possible antioxidant action in 16-HBE cells, we evaluated the effect of 100 µM S-CMC-Lys on the intracellular GSH concentration. A 3 hours treatment with 100 µM S-CMC-Lys caused an increase (p<0.01) of GSH in 16-HBE cells compared to untreated control cells (Fig. 2A). When cells were co-treated with 100 µM S-CMC-Lys and CSE, we found that the effect of 2.5% CSE exposure could be partially reverted (Fig.. 2B), and intracellular GSH significantly increased if compared to CSE, even if the cellular GSH was still lower than in control condition (control: 100 ± 2.9 % n= 25; CSE + S-CMC-Lys : 83.6 ± 3.3 % n= 25; p<0.01) . The effect of 5% CSE exposure, anyway, was not influenced by 100 µM S-CMC-Lys co-treatment (Fig. 2C). After 24 hours of exposure to 5% CSE (Fig. 2D), GSH intracellular levels were not significantly different from those observed in control condition and the co-treatment with 100 µM S-CMC-Lys caused a statistically significant increase of the thiol concentration.
It has been demonstrated that S-CMC-Lys may have a beneficial buffering effect on ROS concentration after the exposure to 5% CSE for 3 hours, that caused the maximal effects on cellular GSH levels, both in the presence and absence of S-CMC-Lys. We found that ROS intracellular levels, that were significantly increased after CSE exposure (Fig. 3), were reverted to a value comparable to the control in the presence of 100 µM S-CMC-Lys.
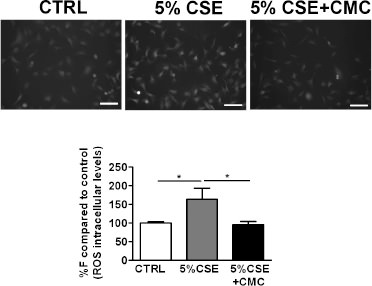
CSE effect on ROS intracellular levels measured in 16-HBE cells. Examples of fluorescence microscopy original images. Each image represents a ROI (region of interest). Graphs represent the average of the mean fluorescence intensity measured in all ROIs, expressed as percentage of control condition (reported as %F compared to control (ROS intracellular levels) in the graphs) recorded in cells exposed to A) PBS (CTRL: control), 5% CSE, 5%CSE and 100 µM S-CMC-Lys (CSE + CMC) for 3 hours (n=70) . n is the number of ROIs. Scale bar = 100 µm. * = p < 0.05 with one-way Anova statistical analysis.
CSE effect on ROS intracellular levels measured in 16-HBE cells. Examples of fluorescence microscopy original images. Each image represents a ROI (region of interest). Graphs represent the average of the mean fluorescence intensity measured in all ROIs, expressed as percentage of control condition (reported as %F compared to control (ROS intracellular levels) in the graphs) recorded in cells exposed to A) PBS (CTRL: control), 5% CSE, 5%CSE and 100 µM S-CMC-Lys (CSE + CMC) for 3 hours (n=70) . n is the number of ROIs. Scale bar = 100 µm. * = p < 0.05 with one-way Anova statistical analysis.
CSE effects on GSH-related enzymes
Cigarette smoke is known to alter the expression and activity of several transcriptional factors, therefore we were interested in evaluating its impact on the gene expression profile of several GSH-related enzymes.
Several enzymes are involved in antioxidative GSH-consuming pathways. Since CSE mediated oxidative stress is mainly due to H2O2 production [27], we assessed the mRNA expression levels of several glutathione peroxidase isoforms (GPx1, 2, and 3) that are known to be expressed in airway epithelial cells [28]. Five conditions were evaluated: control (cells treated with PBS), 3 or 24 hours exposure to 5% CSE and 3 or 24 hours co-treatment with 5% CSE and 100 µM S-CMC-Lys.
After the 3 hours CSE exposure (Fig.. 4A,B,C), the mRNA expression was significantly greater than in controls in the case of GPx2 and GPx3 (Fig. 4B, C). Instead, GPx1 seemed to be unaffected by the 3 hours CSE exposure (Fig. 4A). S-CMC-Lys co-treatment induced a significant decrease of GPx3 mRNA relative expression compared to CSE, but GPx2 mRNA expression was unchanged (Fig. 4C, B). GPx genes expression profile changed after a prolonged (24 hours) CSE exposure (Fig. 4A, B, C). Both GPx2 and 3 mRNA (Fig. 4B,C) were significantly increased (p<0.01) and GPx1 mRNA (Fig. 4A) decreased (p<0.01) compared to the control. Co-treatment with S-CMC-Lys did not further affect GPx expression levels (Fig. 4A, B, C).

CSE effect on glutathione peroxidase (GPxs) mRNA expression levels or activity in 16-HBE cells exposed to PBS (CTRL: control) 5% CSE, 5%CSE and 100 µM S-CMC-Lys (CSE + CMC) for 3 and 24 hours. β-Actin (ACT) mRNA was used to normalize template levels. Values represent the relative expression compared to controls (GPx/ACT mRNA levels). Several GPxs isoforms were evaluated as follows: A) GPx1 (n=5 and n=6 for data obtained after 3 and 24 hours exposure respectively); B) GPx2 (n=4 and n=4 for data obtained after 3 or 24 hours of CSE exposure, respectively); C) GPx3 (n=6 and n=5 for data obtained after 3 or 24 hours of CSE exposure, respectively) D) Glutathione peroxidase (GPx) activity after the exposure to PBS (CTRL: control) 5% CSE, 5% CSE and 100 µM S-CMC-Lys (CSE + CMC) for 24 hours. Values are expressed as percentage of control value (% of ctrl). ** = p < 0.01, * = p < 0.05 with one-way Anova statistical analysis.
CSE effect on glutathione peroxidase (GPxs) mRNA expression levels or activity in 16-HBE cells exposed to PBS (CTRL: control) 5% CSE, 5%CSE and 100 µM S-CMC-Lys (CSE + CMC) for 3 and 24 hours. β-Actin (ACT) mRNA was used to normalize template levels. Values represent the relative expression compared to controls (GPx/ACT mRNA levels). Several GPxs isoforms were evaluated as follows: A) GPx1 (n=5 and n=6 for data obtained after 3 and 24 hours exposure respectively); B) GPx2 (n=4 and n=4 for data obtained after 3 or 24 hours of CSE exposure, respectively); C) GPx3 (n=6 and n=5 for data obtained after 3 or 24 hours of CSE exposure, respectively) D) Glutathione peroxidase (GPx) activity after the exposure to PBS (CTRL: control) 5% CSE, 5% CSE and 100 µM S-CMC-Lys (CSE + CMC) for 24 hours. Values are expressed as percentage of control value (% of ctrl). ** = p < 0.01, * = p < 0.05 with one-way Anova statistical analysis.
GPx3 is an extracellular active isoform and, being secreted in the epithelial lining fluid as well, it plays a primary role in airway protection [29]. GPx activity in the cell medium (Fig. 4D), measured after a 24-hours exposure to CSE, increased significantly and S-CMC-Lys significantly reduced GPx enzymatic activity back to the control value. This result reflects all the changes in GPx3 mRNA expression described by the RT-PCR data, since the enzymatic activity represents a measurement of the secreted GPx accumulated in cell culture media in the whole period of 24 hours, and not simply a photograph of the 24 hours time point.
After GSH consumption in detoxifying or antioxidative pathways, the cell can reconstitute the GSH pool by regeneration from GSSG via GR activity or by de-novo synthesis in a pathway where GCL represents the rate-limiting enzyme.
The relative expression of GR mRNA was evaluated (Fig. 5A, D) and we observed that it significantly increased compared to control, both after 3 and 24 hours of 5% CSE exposure. S-CMC-Lys induced a significant reduction of GR mRNA expression, back to a value comparable to the control, after short-term (3 hours) of CSE exposure (Fig. 5A), but not after long-term (24 hours) CSE exposure (Fig. 5D).

CSE effect on glutamate-cysteine-ligase catalytic subunit (GCLC), glutamate-cysteine-ligase modulatory subunit (GCLM), and glutathione reductase (GR) mRNA expression levels in 16-HBE cells exposed to PBS (CTRL: control) 5% CSE, 5% CSE and 100 µM S-CMC-Lys (CSE + CMC) for 3 and 24 hours. β-Actin (ACT) mRNA was used to normalize template levels. Bar graphs represent the fold changes of mRNA levels expressed as percentage of control condition (mRNA levels). A) GR expression levels after a 3 hours exposure (n=6); B) GCLC expression levels after a 3 hours exposure (n=6); C) GCLM expression levels after a 3 hours exposure (n=4); D) GR expression levels after a 24 hours exposure (n=5); E) GCLC expression levels after a 24 hours exposure (n=4); F) GCLM expression levels after a 24 hours exposure (n=5). ** = p<0.01, * = p<0.05 with one-way Anova statistical analysis.
CSE effect on glutamate-cysteine-ligase catalytic subunit (GCLC), glutamate-cysteine-ligase modulatory subunit (GCLM), and glutathione reductase (GR) mRNA expression levels in 16-HBE cells exposed to PBS (CTRL: control) 5% CSE, 5% CSE and 100 µM S-CMC-Lys (CSE + CMC) for 3 and 24 hours. β-Actin (ACT) mRNA was used to normalize template levels. Bar graphs represent the fold changes of mRNA levels expressed as percentage of control condition (mRNA levels). A) GR expression levels after a 3 hours exposure (n=6); B) GCLC expression levels after a 3 hours exposure (n=6); C) GCLM expression levels after a 3 hours exposure (n=4); D) GR expression levels after a 24 hours exposure (n=5); E) GCLC expression levels after a 24 hours exposure (n=4); F) GCLM expression levels after a 24 hours exposure (n=5). ** = p<0.01, * = p<0.05 with one-way Anova statistical analysis.
GCL is constituted by a catalytic or heavy subunit (GCLC), that is responsible for the GSH synthesis, and a modulatory or light subunit (GCLM), that, by interacting with GCLC, increases its activity. GCLC mRNA expression significantly increased after short- or long-term exposures to 5% CSE (Fig. 5B, E). Analogously, CSE induced an increase of GCLM mRNA at both times (Fig. 5C, F). As observed for GR, S-CMC-Lys could revert the effect of CSE on GCLC and GCLM mRNA expression levels only in the case of a 3 hours exposure (Fig.. 5B, C). After the 24 hours exposure, the GCLC and GCLM mRNA expression levels in the presence of both CSE and S-CMC-Lys did not differ from what observed in the presence of CSE alone (Fig. 5E, F).
At the protein level (Fig. 6, 7), we did not observe any significant reduction of the GCL subunits after 3 hours of CSE exposure (Fig. 6), but after 24 hours GCLM expression significantly increased compared to the control (Fig. 7), and also a slight, even if not significant, increase for GCLC could be measured. None of these short- or long-term effects were affected by S-CMC-Lys.

CSE effect on glutamate-cysteine-ligase catalytic sub-unit (GCLC) and glutamate-cysteine-ligase modulatory subunit (GCLM) protein expression levels in 16-HBE cells exposed to PBS (CTRL: control), 5% CSE, 5% CSE (CSE) and 100 µM S-CMC-Lys (CSE + CMC) for 3 hours. A) Representative Western blots of total protein extracts performed with a monoclonal anti-GCLC antibody (GCLC) or an anti-α-Tubulin Antibody (TUB), used as a loading control. B) Histograms representing mean OD (optical density) value of the GCLC western blot band normalized for the corresponding tubulin (TUB) signal (left graph: CTRL: n=8, CSE: n= 12; right graph: CSE: n= 9, CSE +CMC: n=8). C) Representative Western blots of total protein extracts performed with a polyclonal anti-GCLM antibody or an anti-GAPDH, used as a loading control. D) Histograms representing mean OD value of the GCLM western blot band normalized for the corresponding GAPDH signal (left graph: CTRL: n=16, CSE: n= 16; right graph CSE: n= 18, CSE +CMC: n=17).
CSE effect on glutamate-cysteine-ligase catalytic sub-unit (GCLC) and glutamate-cysteine-ligase modulatory subunit (GCLM) protein expression levels in 16-HBE cells exposed to PBS (CTRL: control), 5% CSE, 5% CSE (CSE) and 100 µM S-CMC-Lys (CSE + CMC) for 3 hours. A) Representative Western blots of total protein extracts performed with a monoclonal anti-GCLC antibody (GCLC) or an anti-α-Tubulin Antibody (TUB), used as a loading control. B) Histograms representing mean OD (optical density) value of the GCLC western blot band normalized for the corresponding tubulin (TUB) signal (left graph: CTRL: n=8, CSE: n= 12; right graph: CSE: n= 9, CSE +CMC: n=8). C) Representative Western blots of total protein extracts performed with a polyclonal anti-GCLM antibody or an anti-GAPDH, used as a loading control. D) Histograms representing mean OD value of the GCLM western blot band normalized for the corresponding GAPDH signal (left graph: CTRL: n=16, CSE: n= 16; right graph CSE: n= 18, CSE +CMC: n=17).

CSE effect on glutamate-cysteine-ligase catalytic subunit (GCLC) and glutamate-cysteine-ligase modulatory subunit (GCLM) protein expression levels in 16-HBE cells exposed to PBS (CTRL: control) 5% CSE, 5%CSE (CSE) and 100 µM S-CMC-Lys (CSE + CMC) for 24 hours. A) Representative Western blots of total protein extracts performed with a monoclonal anti-GCLC antibody or an anti-α-Tubulin Antibody (TUB), used as a loading control. B) Histograms representing mean OD (optical density) value of the GCLC western blot band normalized for the corresponding tubulin (TUB) signal (left graph: CTRL: n=12; CSE: n= 12; right graph: CSE: n= 8, CSE +CMC: n=8). C) Representative Western blots of total protein extracts performed with a polyclonal anti-GCLM antibody or an anti-GAPDH used as a loading control. D) Histograms representing mean OD value of the GCLM western blot band normalized for the corresponding GAPDH signal (left graph: CTRL: n=8, CSE: n= 8; right graph: CSE: n= 4, CSE +CMC: n=4). ** = p<0.01 with t-test statistical analysis.
CSE effect on glutamate-cysteine-ligase catalytic subunit (GCLC) and glutamate-cysteine-ligase modulatory subunit (GCLM) protein expression levels in 16-HBE cells exposed to PBS (CTRL: control) 5% CSE, 5%CSE (CSE) and 100 µM S-CMC-Lys (CSE + CMC) for 24 hours. A) Representative Western blots of total protein extracts performed with a monoclonal anti-GCLC antibody or an anti-α-Tubulin Antibody (TUB), used as a loading control. B) Histograms representing mean OD (optical density) value of the GCLC western blot band normalized for the corresponding tubulin (TUB) signal (left graph: CTRL: n=12; CSE: n= 12; right graph: CSE: n= 8, CSE +CMC: n=8). C) Representative Western blots of total protein extracts performed with a polyclonal anti-GCLM antibody or an anti-GAPDH used as a loading control. D) Histograms representing mean OD value of the GCLM western blot band normalized for the corresponding GAPDH signal (left graph: CTRL: n=8, CSE: n= 8; right graph: CSE: n= 4, CSE +CMC: n=4). ** = p<0.01 with t-test statistical analysis.
Discussion
Cigarette smoke contains high levels of reactive species [30]. Moreover, it can induce cellular production of oxidants [31] that are related to several airway pathologies such as asthma and COPD. Since oxidative stress is known to influence cell viability and proliferation [32,33,34], we studied the effect of CSE exposure on these parameters in 16-HBE cells. CSE is a widely accepted model for studying the effects of tobacco smoke in vitro and in vivo [35,36,37], and contains most of the chemicals inhaled by smokers [38]. Our results demonstrate that CSE increases cell mortality in a dose- and time- dependent manner. Accordingly, MTT assays allowed to demonstrate that cell proliferation is affected by CSE after an exposure of 24 hours in a dose-dependent manner. The CSE-related cell mortality increase is not due to an apoptotic process, well in agreement with the results presented by Pace et al. [20] in the same cell type, where also a necrotic effect has been excluded. The exact mechanism by which cigarette smoke causes loss of the epithelial layer is still controversial. In some cases no apoptosis or necrosis has been detected [20,39], while in other studies both apoptosis [40], necrosis [41] or senescence, a state of irreversible growth arrest [42] have been reported. The observed mortality of 16HBE cells after CSE exposure, that has been observed also in other cell types [43], could be due to a different form of cell death, i.e. an autophagic cell death, whose morphological and biomedical features are distinct from other cell death pathways [44] and that has been demonstrated to be induced by cigarette smoke in airway epithelial cells [45].
Glutathione is the most abundant intracellular antioxidant thiol and is essential to redox protection during oxidative stress. Furthermore, changes in the ratio of the reduced and disulfide form (GSH/GSSG) can affect a broad array of physiological responses. GSH role is particularly crucial in the lung, that is constantly exposed to endogenous metabolic oxidants, as well as to polluting oxidative substances in the ambient air, i.e. ozone, nitrogen dioxide, car exhaust, cigarette smoke etc. [46]. The exposure of 16-HBE cells to CSE caused a significant reduction in GSH intracellular levels after a 3 hours treatment, with this effect increasing proportionally to CSE concentration. At the same time an increase in intracellular ROS was observed after CSE treatment, suggesting that CSE causes an oxidative stress to the cell, which is counteracted by the GSH/GSSG system. After 24 hours exposure, we observed that CSE, even at a 5% concentration, was ineffective on GSH intracellular levels. This result is well in agreement with the findings of Pace et al. showing that total intracellular glutathione is not affected after a 18 hours treatment [20], and has been observed also in other epithelial airway cells [14,47,48], even if not in all cell types [35,49,50]. It could be explained as a cell adaptive response to a chronic CSE exposure. Actually, in some reported cases an overproduction of GSH in the lung results in the enhancement of GSH concentration in lung ELF, after a prolonged CSE exposure [51,52].
Since S-CMC-Lys increases GSH intracellular levels in a respiratory “epithelial-like” cell line, where it limits ROS intracellular increase after oxidant exposure [15], we evaluated the efficacy of this molecule on the GSH concentration and its ability to limit the CSE oxidative burden. As previously demonstrated for WI26-VA4 cells [15], S-CMC-Lys enhanced the intracellular GSH content in 16-HBE cells, an effect that is likely to be related to its activity as a cysteine donor. Moreover, co-treatment with S-CMC-Lys counteracted the 2.5% CSE-induced drop in GSH concentration observed after 3 hours exposure. In contrast, after 3 hours exposure to 5% CSE, apparently S-CMC-Lys could not significantly prevent the CSE-induced GSH drop. However, S-CMC-Lys could reduce ROS intracellular levels to a value that was not significantly different from the control, in accordance to what has been observed also by others, even following prolonged 10% CSE treatment [20]. In this condition, that has a marked impact on the GSH pool, it is likely that the intracellular GSH, whose production is stimulated by S-CMC-Lys, is immediately used to scavenge ROS, resulting in a decreased oxidative stress for the cell without any observable rise in GSH levels. In addition, it is possible that S-CMC-Lys, similarly to N-Acetyl cysteine (NAC), could have a direct effect on ROS, by interacting with its thiol group with the electrophilic groups of ROS [53]. In the case of a long-term 5% CSE exposure, a condition where the cells have already restored their GSH intracellular pool, S-CMC-Lys was able to bring GSH to levels even higher than in control cells, further supporting the hypothesis that it could act as a cysteine donor.
Because of its importance in the regulation of cellular redox state and, consequently, redox mediated signaling pathways, GSH metabolism is tightly regulated in the cell. The intracellular content of GSH is dependent on the balance between its use and synthesis. Therefore we evaluated the expression levels of several cellular enzyme involved in GSH metabolism. Depletion of GSH occurs by different pathways: a) conjugation reaction with electrophilic compounds non enzymatically if the electrophile is very reactive, or, more often, mediated by the action of glutathione S-transferase (GST) [54] b) direct interaction with carbon center radicals (R· ), that allows, acting in concert with superoxide dismutase (SoD), to prevent cell oxidative damage [55] c) reaction with H2O2 or lipid hydroperoxides mediated by the glutathione peroxidases family of enzymes (GPxs) [28].
As it has been established that CSE induce mostly a H2O2 increase in airway epithelial cells [27], we evaluated the expression of several GPx variants following CSE exposure. Eight glutathione peroxidases (GPx1-GPx8) have been so far identified, four of these (GPx1-4) appear to be expressed and functional in the airway cells where they seemed to have an antioxidant function in different locations and cellular compartments [28]. GPx1 is ubiquitously expressed in the cytosol and mitochondria, GPx2 has been firstly isolated in the intestinal epithelium, but it is expressed also in airways epithelial cells, where it can protect from allergen-induced inflammation [56], GPx3 is active in the plasma and in the ELF. All these three isoforms thus work in the water phase, whereas GPx4 appears mostly involved to protect membranes from oxidative challenge and in lipid hydroperoxides cell damage prevention, therefore we excluded this isoform from our evaluation of GPxs mRNA expression. The mRNA of GPx2 and 3 isoforms was significantly up-regulated after 3 and 24 hours of CSE exposure, while GPx1 mRNA, that appeared to be unaffected after 3 hours, significantly decreased after 24 hours. Gpx isoforms have been the most actively investigated enzymes involved in glutathione metabolism; however, how cigarette smoke affects GPxs remains unclear. In some cell types, such as placenta and in the human trophoblast choriocarcinoma (HTR)-8SVNeo cell line, no variations have been reported [57], in contrast an upregulation has been found in lungs of smokers [58,59]. It has been proposed that, in smokers, the antioxidant response of alveolar cells might vary with the smoking status, history and lung pathology of each individual [60]. A reduction of GPx1 expression after 24 hours of CSE exposure has been observed also in other cell lines [61] where it has been hypothesized that the free radical overcharge caused by CSE may be responsible for the inhibition of antioxidant enzymes expression and cell injury. It is interesting to underline that a prolonged exposure to CSE apparently alters the pattern of relative GPxs expression in 16-HBE cells, thus suggesting slightly different roles for the different GPxs, even if they have similar intracellular localization, such as in the case of GPx1 and GPx2. A differential effect of CSE on GPxs has been already hypothesized also in other studies performed on smokers [25,48], where GPx2 and 3 appear to be the main target, similarly to what we found. In the case of GPx3, the increase of its expression and secretion in the lung could help in counteracting the ROS burden in the lining ELF [29,62].
S-CMC-Lys co-treatment, that is ineffective in reverting CSE effect on all the three isoforms analyzed after 24 hours of CSE exposure, induces a significant reduction of the expression of GPx3 mRNA in the first 3 hours of CSE exposure. This effect on GPx3 expression was reflected also in the decreased activity, i.e. a reduced secretion, of the enzyme in the cell medium. This is possibly a consequence of the reduced oxidative stress of the cells in the initial phase of treatment, that is likely to decrease the strength of the cell adaptive response. In the case of prolonged stress condition (24 hours), when the initial drop of GSH is recovered and cellular toxicity exerted by CSE becomes significant, S-CMC-Lys did not affect anymore the response induced by CSE on the expression of GPxs. Accordingly, a similar, biphasic effect of S-CMC-Lys has been observed also in the case of other critical enzymes controlling GSH production (i.e. GCL and GR).
The mRNA of GR, that regenerates GSH from GSSG formed by peroxidases, is increased both after 3 and 24 hours of CSE exposure, indicating that also this enzyme is involved in the cell response to the CSE-induced stress. As observed for GPx, S-CMC-Lys can revert this effect in the first hours of exposure, but the long term 24 hours CSE effect was not affected.
Analogous considerations can be made in the case of GCL subunits (the catalytic GCLC and the modulatory GCLM). GCLC possesses all the enzymatic activity and it is the site of GSH feedback inhibition, whereas the GCLM subunit increases in vivo the Ki of the enzyme for GSH, i.e. it decreases the feedback inhibition by GSH [63]. Again, we observed an increase of both GCLC and GCLM mRNA after 3 or 24 hours exposure to CSE, with this effect being reversed by S-CMC-Lys after 3 hours of exposure, but not after 24 hours of exposure. The effect of CSE was more pronounced in the case of GCLM, suggesting that it might be the main target of fast regulation of the enzyme activity. At the protein level, we could not observe a significant variation of GCLC and GCLM expression after 3 hours of treatment, both in the presence and in the absence of S-CMC-Lys. The discrepancy between the effect of CSE on mRNA and protein expression levels could be explained by the observation that the correlation between protein and mRNA expression is often not univocal, especially in the case of genes involved in the regulation of biological processes [64.] Only after 24 hours of CSE exposure a trend to increase for the GCLC protein (even if not significant) and a significant increase of GCLM protein expression could be measured. The higher expression of the modulatory subunit, by increasing GCL enzymatic activities, could be the main responsible for the recovery of the initial (3 hours) GSH drop. An upregulation of GCL expression by oxidative stress has been reported also by others and it has been related to the increased production of inflammatory cytokines, such as TNF-α, that induce the translocation of transcription factors, such as Nrf-2, NF-kB and c-Jun, in the nucleus [35,65].
Conclusion
The present study demonstrates that, in bronchial 16-HBE epithelial cells, CSE negatively affects cell viability and leads to a variation of intracellular GSH and ROS, causing oxidative stress. CSE exposure induces a biphasic response in respiratory cells and a prolonged exposure results in a recovery of the initial GSH drop (adaptive response), characterized by an upregulation of the expression of the enzymes involved in GSH synthesis and ROS detoxification. The recovery of the GSH intracellular concentration observed during the CSE adaptive response seems to be attributable mainly to an increase in the expression of the modulatory subunit of GCL, that leads to an increment of enzymatic activity and, consequently, to a boost of GSH synthesis. Of the different GPx isoforms expressed in airway epithelial cells, GPx2 and 3 appear to be those mostly involved in cellular defense toward CSE.
Besides its known action as a mucolytic drug, S-CMC-Lys can to some extent counteract the CSE-related oxidative burden, and could therefore be beneficial for the treatment of cigarette smoke associated pathologies. Further in vivo studies are needed to explore the molecular mechanisms and the effects of carbocysteine in smokers.
Abbreviations
16-HBE (human bronchial epithelial cells); A (Absorbance); ACT (β-actine); CFTR (cystic fibrosis transmembrane conductance regulator); CM-H2DCF-DA (5-(and 6)-chloromethyl-2',7'-dichlorodihydrofluorescein-diacetate, acetyl ester); COPD (chronic obstructive pulmonary disease); COX-2 (cyclooxigenase 2); CSE (cigarette smoke extract); D-PBS (Dulbecco's phosphate-buffered saline); ELF (epithelial lining fluid); EMEM (Eagle's minimum essential medium); FBS (fetal bovine serum); GCL (glutamate-cysteine-ligase); GCLC (glutamate-cysteine-ligase catalytic subunit); GCLM (glutamate-cysteine-ligase modulatory subunit); GM-CSF (granulocyte-macrophage colony-stimulating factor); GPx (glutathione peroxidase); GPx1 (glutathione peroxidase 1); GPx2 (glutathione peroxidase 2); GPx3 (glutathione peroxidase 3); GPx4 (glutathione peroxidase 4); GR (glutathione reductase); GS (glutathione synthase); GSH (reduced glutathione); GSSG (oxidized glutathione) ICAM-1; (intercellular adhesion molecule 1); IL-1 (interleukin 1); IL-6 (interleukin 6); IL-8 (interleukin 8); iNOS (inducible nitric oxide synthase); MCB (monochlorobimane); MIP-1α (Macrophage Inflammatory Proteins); MMP-9 (Matrix metallopeptidase 9); MTT (3-[4,5-dimethylthiazol-2-yl]-2,5-diphenyltetrazoliumbromide); NAC (N-acetyl cysteine); NF-κB (nuclear factor kappa-light-chain-enhancer of activated B cells); Nrf-2 (nuclear factor erythroid 2-related factor 2); OD (optical density); PBS (phosphate-buffered saline); qPCR (Real-time quantitative PCR); R· (carbon center radicals); ROS (reactive oxygen species); S-CMC-Lys (S-carboximethilcysteine, lysine salt); SoD (superoxide dismutase); TNF-α (tumor necrosis factor alpha); VCAM-1 (vascular cell adhesion molecule 1).
Conflict of Interests
Although G. Meyer received research funds from Dompè Farmaceutici S.p.A. and Luigi Lanata and Michela Bagnasco are employed by Dompè Farmaceutici S.p.A., these relationships did not influence authors' objectivity. For other authors no conflict of interest exists.

