

Abstract
Background: It has been suggested that exhaled breath contains relevant information on health status. Objectives: We hypothesized that a novel mass spectrometry (MS) technique to analyze breath in real time could be useful to differentiate breathprints from chronic obstructive pulmonary disease (COPD) patients and controls (smokers and nonsmokers). Methods: We studied 61 participants including 25 COPD patients [Global Initiative for Obstructive Lung Disease (GOLD) stages I-IV], 25 nonsmoking controls and 11 smoking controls. We analyzed their breath by MS in real time. Raw mass spectra were then processed and statistically analyzed. Results: A panel of discriminating mass-spectral features was identified for COPD (all stages; n = 25) versus healthy nonsmokers (n = 25), COPD (all stages; n = 25) versus healthy smokers (n = 11) and mild COPD (GOLD stages I/II; n = 13) versus severe COPD (GOLD stages III/IV; n = 12). A blind classification (i.e. leave-one-out cross validation) resulted in 96% sensitivity and 72.7% specificity (COPD vs. smoking controls), 88% sensitivity and 92% specificity (COPD vs. nonsmoking controls) and 92.3% sensitivity and 83.3% specificity (GOLD I/II vs. GOLD III/IV). Acetone and indole were identified as two of the discriminating exhaled molecules. Conclusions: We conclude that real-time MS may be a useful technique to analyze and characterize the metabolome of exhaled breath. The acquisition of breathprints in a rapid manner may be valuable to support COPD diagnosis and to gain insight into the disease.
Introduction
Chronic obstructive pulmonary disease (COPD) is a complex illness, which is sometimes difficult to properly diagnose and for which many fundamental questions remain unanswered [1]. There is a clear need to increase our knowledge of the COPD phenotype for the ultimate purpose of improving diagnostics [2].
Taking samples from the lung itself (e.g. induced sputum) to perform analytical measurements can be difficult, and for this reason the analysis of exhaled breath is eliciting considerable interest as it offers the unique advantage of probing the lung itself, but in a noninvasive fashion [3,4]. As a result, in recent years, a number of techniques have been developed to analyze exhaled breath for investigating COPD among other lung diseases. These include the analysis of exhaled-breath condensate [5,6,7,8,9,10,11,12], exhaled particles [13] and volatile compounds [14,15,16,17,18,19,20]. Even trained dogs seem to be able to recognize the peculiar scent of COPD in exhaled breath [21].
A new mass spectrometry (MS) technique has been developed which aims to detect trace compounds in breath or any other matrix in real time [22,23,24,25,26,27,28]. This technique has been termed secondary electrospray ionization MS (SESI-MS, also dubbed ‘extractive electrospray ionization') [29], and in a clinical context, it has shown promise for the diagnosis of bacterial infections based on their emitted volatile ‘breathprints' [30,31,32,33,34]. This study seeks to expand SESI-MS applications in order to develop noninvasive techniques to characterize COPD through exhaled breath. In particular, the aim of this exploratory study was to assess, for the first time, whether or not SESI-MS holds promise to be able to identify subjects with COPD. Given that this technique has never been used to study any lung disease, the type of response of SESI-MS to be expected in such cases was completely unknown. For this reason, we deliberately chose to include a young and healthy control group. The aim was to establish the lower and upper bounds to be expected in future measurements with age-matched controls, similar to previous pilot studies on breath analysis [35]. We nevertheless attempted to characterize potential differences between COPD patients with the mild or moderate stages [Global Initiative for Obstructive Lung Disease (GOLD) I/II] and the severe or very severe stages (GOLD III/IV) of the disease. We therefore analyzed the breath of this heterogeneous group and applied statistical methods to reveal whether or not differences in breath patterns would be observable in such cases.
Material and Methods
Subjects
A group of 61 subjects participated in this study: 25 healthy nonsmokers, 11 healthy asymptomatic smokers and 25 patients affected by COPD.
Inclusion criteria for subjects with COPD were: males and females aged between 40 and 75 years, objectively diagnosed with COPD according to the GOLD guidelines [36]. Exclusion criteria were: having (1) a mental or physical disability precluding informed consent or compliance with the protocol, and (2) an acute exacerbation of COPD within the last 6 weeks.
Inclusion criteria for nonsmoking controls were: males and females aged between 18 and 75 years with no clinical signs of lung disease. Exclusion criteria were: (1) having a mental or physical disability precluding informed consent or compliance of the protocol; (2) being pregnant, and (3) being a current smoker.
Inclusion criteria for smoking controls were: (1) males and females aged between 18 and 75 years with no clinical signs of lung disease, and (2) being a current smoker. Exclusion criteria were: (1) having a mental or physical disability precluding informed consent or compliance with the protocol, and (2) being pregnant.
The COPD stage (i.e. severity of airflow limitation) was assessed based on post-bronchodilator forced expiratory volume in 1 s (FEV1). As a result, 13 COPD patients were diagnosed as mild or moderate (GOLD stages I/II) and 12 were diagnosed as severe or very severe (GOLD stages III/IV). Two out of the 25 COPD patients had never smoked, while 18 were ex-smokers and 5 were still smoking.
The participants were asked not to smoke, eat, drink (except water) or brush their teeth (including the use of mouthwash or sprays) for at least 1 h before the measurements were performed. Subjects were randomly allocated to measurement slots in order to prevent any bias due to instrument drift.
The study was carried out in accordance with the Declaration of Helsinki of the World Medical Association. The local ethics committee approved the study (COPD patients EK-NR: 2011-0106 and healthy controls: EK 2012-N-49) and all subjects gave their written informed consent to participate. Measurements took place between March 3 and June 5, 2012.
Mass Spectrometry Measurements
The experimental set-up was previously presented in detail [22,24,26,28,30,31,32,33,34,37]. Briefly, the entrance of a commercial quadrupole time-of-flight mass spectrometer (Ultima, Waters, Milford, Mass., USA) was slightly modified to allow for the admission of breath samples through a heated Teflon tube. Exhaled breath was mixed with a nanoelectrospray plume (water and 0.2% formic acid), whereby some compounds present in the breath were readily detected in real time. The mass spectrometer was operated in the positive-ion mode. The subjects were asked to provide a deep exhalation through a disposable mouth piece, while keeping the pressure through the sampling tube at 20 mbar (monitored by a digital manometer), thereby ensuring that each subject breathed at the same flow rate (approx. 1.8 liters/min). This process was repeated 6 times per subject, with the 6 replicate measurements taking typically ≤10 min. Online supplementary figure S1 (www.karger.com/doi/10.1159/000357785) shows a picture of a SESI-MS breath analysis set-up.
Statistical Analysis
The mass spectra, comprising the last few seconds of each exhalation, which reflects the exhaled composition of the lower respiratory tract, were averaged via Masslynx (i.e. Water's software) and exported as text files. These raw mass spectra were then processed using the commercial software MATLAB (R2012a, Mathworks Inc., Natick, Mass., USA). The original mass spectra were interpolated to 10,000 mass-to-charge (m/z) values (56-400 Da; binned to Δm/z = 0.0187 Da). The spectra were normalized by standardizing the area under the curve to the median. The local maxima of each peak were identified, resulting in 1,260 features with a threshold intensity of 10 counts. The 6 replicate measurements of each subject were averaged and, finally, a 61 × 1,260 matrix was assembled. The 61 participants were allocated to 1 of the following groups: healthy nonsmokers, healthy smokers, mild COPD (GOLD I/II) and severe COPD (GOLD III/IV).
The analysis was conducted by pairs of groups separately: COPD (all stages; n = 25) versus healthy nonsmokers (n = 25), COPD (all stages; n = 25) versus healthy smokers (n = 11) and mild COPD (GOLD I/II; n = 13) versus severe COPD (GOLD III/IV; n = 12).
We first sought to reduce the dimensionality of the matrices by extracting the most significant features to discern these 4 groups. In this way, the noisiest peaks stemming from background air, chemical noise, etc. were largely excluded from the subsequent analysis. To do so, a Mann-Whitney U test was performed, looping each of the 1,260 m/z values [38]. To prevent the inclusion of the noisiest peaks in further analysis, we did not consider the signal if the median for the 2 groups compared was <50 counts. Upon performance of the Mann-Whitney U test, only the signals with p values <0.05 (chosen significance level) were retained (4 for mild vs. severe, 37 for COPD vs. nonsmoking controls and 69 for COPD vs. smoking controls).
Thus, the original data was reduced to matrices of 25 × 4 (GOLD I/II vs. GOLD III/IV), 36 × 69 (COPD vs. smoking controls) and 50 × 37 (COPD vs. nonsmoking controls). To enable visualization of these data, the matrices were autoscaled [39] and subjected to principal component analysis [40]. Finally, the prediction power of these subsets of signals was assessed. A k-nearest neighbor (k-NN; Euclidean distance) classification algorithm was used to predict the class of a given breath spectrum in a leave-one-out cross validation exercise (i.e. each of the samples was left out of the model once and classified).
Results
Subjects
The baseline characteristics of the 4 subgroups are shown in tables 1 and 2. As expected, FEV1 and FVC values in COPD patients were lower than in both smoking and nonsmoking controls. Patients with COPD were older, had smoked more pack-years than the controls and were being treated with various medications, including inhalational COPD therapy. However, the 2 COPD subgroups showed comparable characteristics.


Mass-Spectral Breathprints
Figure 1 shows the typical ion intensity as a function of time for 4 selected m/z values present in the breath of a random selection of 12 subjects. Each trace (m/z 59, 205, 253 and 343) corresponds to one compound present in breath for at least 1 of the 12 participants (labeled 1-12 at the top of the m/z 59 trace). Subjects 2, 3 and 4 are COPD patients. Each subject breathed 6 consecutive times, the whole process taking typically <10 min/subject. For example, for the trace at m/z 59, it is clearly observable how the ion intensity rises above the background level 6 times for all 12 subjects. This particular compound corresponds to acetone, as it has been previously characterized [22]. For each individual, the height (intensity) of the acetone peaks is very similar for the 6 breaths, indicating a satisfactory repeatability (average of 12% RSD for the 61 participants) and robustness of the measurements, even for COPD patients (fig. 1 - see zoom of acetone-subject 3), but clearly different among individuals [41].

Time trace of the ion current for 4 selected m/z values (59, 201, 253 and 351) monitored in the breath of 12 randomly selected subjects. Individuals labeled as 2, 3 and 4 correspond to COPD patients (GOLD stages IV, IV and II, respectively), while the rest of the subjects shown in this example were nonsmoking controls. Each subject provided 6 consecutive breath samples. The top trace shows a zoom at m/z 59 (acetone) of the 6 replicate measurements of one of the COPD patients. It illustrates that excellent repeatability can be obtained even in cases of impaired breathing capacity. Note also how each subject shows a distinct breathprint.
Time trace of the ion current for 4 selected m/z values (59, 201, 253 and 351) monitored in the breath of 12 randomly selected subjects. Individuals labeled as 2, 3 and 4 correspond to COPD patients (GOLD stages IV, IV and II, respectively), while the rest of the subjects shown in this example were nonsmoking controls. Each subject provided 6 consecutive breath samples. The top trace shows a zoom at m/z 59 (acetone) of the 6 replicate measurements of one of the COPD patients. It illustrates that excellent repeatability can be obtained even in cases of impaired breathing capacity. Note also how each subject shows a distinct breathprint.
Discrimination of Study Groups
The collected breath mass spectra were processed statistically with the aim of ultimately discriminate the study groups. Figure 2 (left) shows 3 box plots corresponding to 3 representative features found in this study to yield a p value of <0.05 after a Mann-Whitney U test. The right plot shows a zoom of the mass spectrum in the region of interest with all the traces corresponding to each participant overlaid. The top peak, which corresponds to acetone, was found significantly increased in COPD versus healthy smokers (p < 0.01). The middle graph (m/z 118) was found to be significantly (p < 0.005) decreased in COPD patients' breath compared to the healthy nonsmoking controls. The bottom graph shows an example of one peak found to be increased in GOLD stages III/IV vs. I/II (p < 0.05). Tables 3, 4, 5 list the remaining peaks found in this study to be differently exhaled among the different groups under study. Figure 3 shows the corresponding principal component analysis plots for the signals listed in tables 3, 4, 5.
Mass-spectral features found to be exhaled at significantly (p < 0.05) different concentrations by COPD subjects and nonsmoking controls

Mass-spectral features found to be exhaled at significantly (p < 0.05) different concentrations by COPD subjects and smoking controls
Mass spectral features found to be exhaled at significantly (p < 0.05) different concentrations by both COPD subgroups

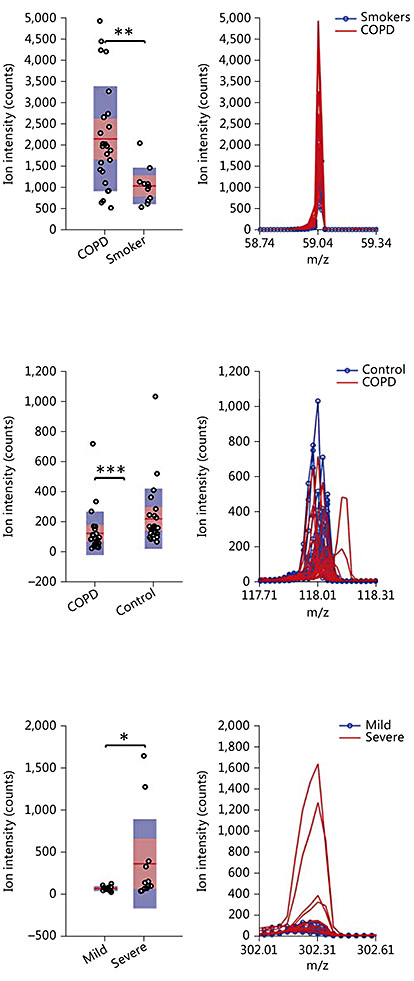
Examples of compounds found to be exhaled at different concentrations between COPD subjects and smoking controls (top), COPD subjects and nonsmoking controls (middle) and those with COPD GOLD stages I/II and III/IV (bottom). The feature at m/z 59 corresponds to acetone and the one at m/z 118 to indole (most probable identity). * p < 0.05, ** p < 0.01 and *** p < 0.005.
Examples of compounds found to be exhaled at different concentrations between COPD subjects and smoking controls (top), COPD subjects and nonsmoking controls (middle) and those with COPD GOLD stages I/II and III/IV (bottom). The feature at m/z 59 corresponds to acetone and the one at m/z 118 to indole (most probable identity). * p < 0.05, ** p < 0.01 and *** p < 0.005.

3-Dimensional principal component analysis (PCA) plot of the mass-spectral breathprints containing the most significant features of COPD subjects and smoking controls (a), COPD subjects and nonsmoking controls (b) and subjects with COPD GOLD stages I/II and III/IV (c). As expected, clustering according to health status is more obvious in the COPD vs. healthy controls (a, b) than in the COPD subgroups (c).
3-Dimensional principal component analysis (PCA) plot of the mass-spectral breathprints containing the most significant features of COPD subjects and smoking controls (a), COPD subjects and nonsmoking controls (b) and subjects with COPD GOLD stages I/II and III/IV (c). As expected, clustering according to health status is more obvious in the COPD vs. healthy controls (a, b) than in the COPD subgroups (c).
Finally, we tested whether these sets of exhaled compounds may be used to predict the presence/absence of disease and disease stage. Table 6 summarizes the classification results for the 3 binary comparisons performed, where 24/25 COPD patients and 8/11 smokers, 22/25 COPD patients and 23/25 nonsmokers and 12/13 GOLD stages I/II and 10/12 GOLD stages III/IV were correctly classified for each of the 3 leave-one-out cross-validations.

Discussion
The analysis of exhaled breath is believed to hold promise in the study of lung diseases since exhaled air is in direct contact with the respiratory tract and therefore may carry relevant biological markers. For this reason, quite some efforts have been devoted over the last years to develop instrumentation and methods capable of detecting exhaled biomarkers for a number of lung diseases, including COPD [42].
For example, the analysis of exhaled-breath condensate, covering molecules ranging from small metabolites to large proteins [3], has been shown to shed light on the disease phenotype [5,7]. The main drawback of analyzing exhaled-breath condensate is likely associated with the difficulty to standardize sample collection. For this reason, new sample collection techniques are currently under development and investigation [13,43].
Another technology targeting exhaled breath is the so-called electronic nose, which responds to combinations of volatiles present in breath providing breathprints amenable for statistical analysis [15,16]. However, this technology is not suitable to provide structural elucidation of the breath compounds providing separation among different cohorts, which is crucial for gaining insight into underlying biochemical COPD mechanisms. On the other hand, an advantageous feature is the portability of these devices. Similarly, gas chromatography ion mobility spectrometry provides good portability and pattern identification, but lacks unambiguous structural identification capabilities [14,17].
Complementarily to these techniques, breath can be analyzed by MS, either off-line (e.g. gas chromatography MS [15,44]) or in real time by a number of different techniques. The main advantage of MS is its selectivity (especially high-resolution instruments), which enables a wide analyte coverage as well as the structural identification of the components detectable in breath. There are mainly three different approaches to analyze breath in real time: proton transfer reaction MS [45], selected ion flow tube MS [46] and SESI-MS.
In real-time techniques (i.e. no sample collection-manipulation), the risks of introducing artifacts due to sample handling are minimized. Not only is the acquisition of the breathprint data fast, but also the complete processing and classification of the spectra afterwards can be performed rapidly. For example, the whole process including the 6 replicate breath analyses and the statistical classification (diagnosis) can be accomplished in 10 min. Currently, the main drawback of SESI-MS, as opposed to electronic noses, for example, is the lack of portability.
All the real-time MS techniques available nowadays can detect compounds of relatively high volatility, e.g. acetone, which is a well-known metabolite present in breath [47,48] (fig. 1, 2, m/z 59). However, the excellent sensitivity of SESI-MS (down to parts-per-trillion [24,49]) offers the opportunity to target a set of molecules never observed before in breath in real time [22,23,24,50]. A recent model has proposed that ionization at atmospheric pressure leads to higher ionization efficiencies, which may explain SESI-MS efficiency in this relatively high m/z range [51]. Notice, for example, that species with molecular weights as large as m/z 343 are clearly detectable (fig. 1). Another example is the data in tables 3, 4, 5, where masses well beyond m/z 200 (the typical m/z limit of other on-line techniques) strongly contribute to discerning COPD patients and controls. Indeed, it is reasonable to hypothesize that more complex (heavier) biomolecules may carry more accurate information since they may be linked to just one particular biochemical process, rather than to several.
In contrast with electronic noses, for example, one major advantage of MS is that it allows for the chemical characterization of the detected exhaled molecules. For example, by further fragmentation measurements, the ion seen at m/z 59 was assigned to acetone [22], which is an intermediate of the synthesis and degradation of ketone bodies and propanoate metabolism (http://www.kegg.jp/dbget-bin/www_bget?cpd:C00207). In this study, acetone was found to be exhaled in lower concentrations in the smokers group than among the COPD patients (fig. 2).
In the second phase of our study, we had access to a high-resolution instrument with fragmentation capabilities (Waters' Synapt G2S). While the identification with high confidence of the large number of compounds found in breath via SESI-MS is ongoing, we anticipate here that, based on accurate mass, isotopic pattern and MS/MS data, the peak at m/z 118 corresponds to indole. It was also tentatively identified in breath via selected ion flow tube MS [52] and it has been unambiguously detected off-line (gas chromatography MS). Recently, it was found to be increased in humans who are under stress [53], and in patients suffering liver malfunction compared to a healthy cohort, it was found to be decreased [54]. Indole is one metabolite involved in tryptophan metabolism (http://www.kegg.jp/dbget-bin/www_bget?cpd:C00463) and binds to albumin in blood [55]. At present, the reasons why indole may be decreased in COPD patients' breath are unclear and this finding is under further investigation for confirmation.
Another interesting observation made is that the combination of the large number of different components detectable in breath by SESI-MS provides a sort of unique ‘fingerprint' for each individual, observable even by visual inspection (fig. 1). The existence of individual metabolic phenotypes, which seem to be stable during prolonged periods, has been hypothesized and experimental evidence has been published [56]. Previous [24] and recent [41] investigations by our group support this hypothesis via the analysis of exhaled breath. This finding has important implications in personalized healthcare [57] since, for example, it is conceivable to monitor health status through breath in an individualized fashion (e.g. monitoring of COPD exacerbation episodes and response to medication).
Our study has some limitations. At this exploratory stage, we selected a heterogeneous control group involving young healthy smokers and nonsmokers, with the aim that differences among the groups be readily observable. This was indeed the case, and therefore current efforts are being devoted to confirm if the satisfactory classifications obtained here may be achievable in age-matched control groups. Note that both COPD subgroups studied above had a comparable mean age and that even so, they could be classified (table 6). This suggests that the observed differences between groups indeed stem from states of disease/nondisease rather than from age differences. Similarly, the COPD patients were on medications for COPD and comorbidities. As shown previously [58], our technique seems suitable for monitoring pharmacokinetics through exhaled breath. Thus, it is conceivable that medications may be potential confounders [59]. However, except for a higher number of patients using inhaled steroids in the COPD GOLD III/IV subgroup than in the GOLD I/II subgroup, these subgroups were on similar medications and we were able to detect differences in their breathprints (fig. 2, 3; table 5). Despite this limitation, and given the precedent on antiepileptic drug monitoring in breath [58], we hypothesize that this technique might also be useful for a better understanding of the mechanism of action of drugs for COPD [60,61,62].
To our knowledge, this is the first real-time MS study investigating the exhaled breath of COPD patients. We conclude that exhaled breath can be analyzed in real time covering masses well beyond 300 Da. We collected 6 replicate measurements per subject in <10 min, on average, with excellent repeatability and with a strong individual-dependent response. A subset of mass-spectral features discriminating COPD (all stages; n = 25) versus healthy nonsmokers (n = 25), COPD (all stages; n = 25) versus healthy smokers (n = 11) and mild COPD (GOLD I/II; n = 13) versus severe COPD (GOLD III/IV; n = 12) were identified. These exhaled molecules were satisfactory predictors of the presence/absence of disease and an indication of disease stage.
This study provides a qualitative indication, suggesting that real-time breath analysis could add valuable information to the current state-of-the-art in COPD diagnosis and phenotyping. While it is premature to conclude that this technique will be used routinely in the future to diagnose COPD as well as to understand its underlying mechanisms, these exploratory measurements are encouraging for the further pursuit of this approach.
Acknowledgements
This research was supported by a Marie Curie European Reintegration Grant (PMLS) within the 7th European Community Framework Programme (276860). René Dreier is gratefully acknowledged for constructing the sampling device.
