

Abstract
The aims of this study in hemodialysis (HD) patients were: 1. To evaluate the relationship of calf bioimpedance with total body composition and fluid status as measured by gold standard methods. 2. To investigate the ability of calf normalized resistivity (CNR) to predict the normal fluid status (dry weight: DW) in a prospective study. In the body composition study (n = 41), fluid status (ECVBr/FFMMRI), muscle mass (MMMRI), and total adipose tissue (TATMRI) were measured by dilution (D2O and Br) and MRI methods three hours prior to HD treatment. Calf extracellular and intracellular resistance, resistivity, and CNR were measured with a multi-frequency bioimpedance device (Hydra 4200). In the fluid status study (n = 32 with 429 measurements), a nonlinear model based on the differences in CNR between patients and healthy subjects was established to predict DWcBIS previously determined by a separate continuous calf bioimpedance spectroscopy (cBIS) method. CNR significantly correlated with a gold standard hydration marker (ECVBr/FFMMRI). Calf body composition models were highly correlated with MMMRI (R2 = 0.85) and TATMRI (R2 = 0.85). DWcBIS prediction was validated with a CNR model in the degree of differences of 0.94 ± 0.18, 0.39 ± 0.7 and -0.02 ± 0.8 kg from DWcBIS when post HD fluid overload was 1.8 ± 1.2, 1.15 ± 0.8 and 0.54 ± 0.5 kg, respectively. These differences are not considered to be clinically significant. Conclusion: This practical method of calf bioimpedance is useful to predict body composition and normal fluid status in dialysis patients.
Introduction
The estimation of the normal fluid status (dry weight) in hemodialysis (HD) patients is a significant problem because of lack of understanding of the physiological concept of dry weight and of appropriate techniques to measure fluid status accurately and precisely [1]. Bioimpedance techniques (BIT) are useful in the management of fluid status in routine dialysis [2,3]. BIT application in clinical studies include whole body, single-frequency bioimpedance vector analysis (BIVA) [4], whole body multi-frequency bioimpedance spectroscopy (wBIS) [5,] and calf bioimpedance spectroscopy (cBIS) [6], each with individual benefits and limitations [7,8]. Whole body (wrist to ankle) techniques using four electrodes are widely used with acceptable accuracy for subjects in fluid equilibrium and with normal body composition [9,10,11]. However, the accuracy is affected when fluid distribution changes between body segments or variably by body composition as reflected by body mass index (BMI) [12,13].
Continuous intradialytic calf bioimpedance spectroscopy (cBIS) has been used to determine dry weight (DWcBIS) as defined by two criteria: (1) when the curve of the ratio of calf extracellular resistance (cRe) at the beginning (cRe₀) to the cRe at any time (cRet) during HD becomes and remains flat (change <1% of cRe₀/cRet) during twenty minutes of continuing dialysis; and (2) an increase of calf normalized resistivity (CNR) to the threshold of the range in the healthy population (18.5 (10-2·Ω·m3/kg) for males and 19.2 (10-2·Ω·m3/kg) for females) [6]. The cBIS measurement is not affected by fluid distribution or body composition because the continuous measurement of only one segment reflects relative changes in resistance. CNR is also not affected because of normalization by BMI [14,15]. However, this method has limitations, including inconvenience for dialysis patients due to the requirement of constant body position during the entire treatment [16]. In addition, it has not been demonstrated how calf measurement represents total body fluid status.
The aims of this study were to: (1) Evaluate the relationship of calf bioimpedance measurement with body composition and fluid status measured by isotope dilution (D2O and Br), total body potassium (TBK) and magnetic resonance imaging (MRI) methods. (2) Investigate in a validation study whether CNR can be used to predict DWcBIS as an alternative to the continuous intradialytic method.
Methods
The study protocols for the two separate studies were approved by the IRB of Beth Israel Medical Center. All patients gave signed consent.
Study 1
At least three hours prior to HD treatment, total body water (TBWD2O) and extracellular fluid volume (ECVBr) were measured by the dilution of deuterium and bromide, respectively and intracellular fluid volume (ICVTBK) by total body potassium (TBK) [17]. Muscle mass (MMMRI) and total adipose tissue (TATMRI) were estimated by MRI. Fat free mass (FFMMRI) is defined as the difference between body weight and TATMRI. The gold standard hydration marker is represented by ECVBr/FFMMRI pre HD and post HD ECVBr/FFMMRI is calculated by a known ultrafiltration volume (see appendix). Calf bioimpedance spectroscopy (cBIS) was performed with subjects in a supine position using a multi-frequency (5-1,000 kHz) device (Hydra 4200) pre- and post-HD. Calf extracellular (cRe) and intracellular (cRi) resistances were obtained with the Cole model [18]. Calf resistance (cR5) at 5 kHz, calf resistivity (Rho), CNR and calf cross-sectional area were calculated [19]. Equations for calculating calf parameters are shown in the appendix. Calf bioimpedance parameters are used to establish the model to estimate body hydration and body composition.
Study 2
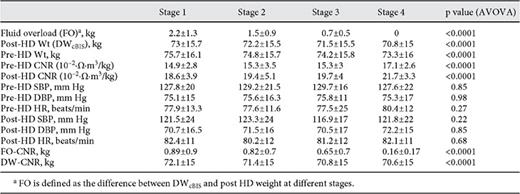
Study 2 target post-HD weight was prescribed at baseline (BL); DWcBIS was determined by the two criteria described above with the continuous cBIS technique using a modified Xitron device (frequency range from 1 to 300 kHz) [6]. The target post HD weight was reduced by 0.2-0.3 kg for each treatment until DWcBIS was attained. In this paper, we focus on whether the DWcBIS can be predicted using post HD CNR only in patients with varying degrees of fluid overload (FO). Total fluid overload (TFO) was defined as the difference between post HD weight at the start of the study (BL) and DWcBIS. In order to analyze the effect of FO on the accuracy of prediction of DWcBIS, TFO was divided into four stages: stage 1 (BL), and stages 2, 3, and 4 (DWcBIS) with each stage representing one third of the TFO [15]. Ten of thirty-two patients were studied to develop a model to predict DWcBIS by CNR based on the relationship between change in CNR and change in weight from BL to DWcBIS. In the other 22 patients, the developed model was applied to validate its ability to predict DWcBIS. Systolic (SBP), diastolic (DBP) blood pressure, and heart rate (HR) were recorded pre- and post-HD.
Data are presented with mean ± SD. The difference in parameters between stages was identified using the ANOVA analysis by GraphPad Prism 5. The multiple regression model based on calf bioimpedance measurement for estimating body composition was established by SYSTAT13. A p value less than 0.05 was considered significant.
Results
Study 1
N = 41, 23 m, age 54.7 ± 11 years; no calf bioimpedance parameters correlated with the gold standard hydration marker ECVBr/FFMMRI except CNR (table 1 and fig. 1). Pre-HD calf extracellular resistance (cRe) significantly correlated with TBWD2O and ECVBr and cR5 with TBWD2O only while calf intracellular resistance (cRi) correlated with MMMRI and TBK (ICVTBK). The correlation between CNR and ECVBr/FFMMRI was greater post-HD (R2 = 0.21, p < 0.01) than pre HD (R2 = 0.13, p < 0.05). Calf circumference correlated significantly with all parameters of body composition but did not correlate with the ECVBr/FFMMRI. The calf body composition model (CBM) was used to calculate TATCBM and MMCBM, which correlated highly with TATMRI (R2 = 0.85, p < 0.0001) and MMMRI (R2 = 0.85, p < 0.0001), respectively (fig. 2a and b). BMI strongly correlated (R2 = 0.78, p < 0.0001) with TATMRI but weakly (R2 = 0.26, p < 0.01) with MMMRI (fig. 3a and b).


Estimation of muscle mass (MM) (a) and total body adipose tissues (TAT) (b) with calf bioimpedance model (CBM) show: MMCBM = -0.103 * cRi + 30.58 *Height + 0.159 * weight - 0.098 * Age - 28.736, and TATCBM = 0.13 * cRi - 0.142 *CA + 2.43 * BMI + 0.129 * Age - 44.33, where cRi is calf intracellular resistance (Ω), Height is body height (m) and weight (kg). CA is average calf cross-sectional area (cm2); BMI is body mass index (kg/m2).
Estimation of muscle mass (MM) (a) and total body adipose tissues (TAT) (b) with calf bioimpedance model (CBM) show: MMCBM = -0.103 * cRi + 30.58 *Height + 0.159 * weight - 0.098 * Age - 28.736, and TATCBM = 0.13 * cRi - 0.142 *CA + 2.43 * BMI + 0.129 * Age - 44.33, where cRi is calf intracellular resistance (Ω), Height is body height (m) and weight (kg). CA is average calf cross-sectional area (cm2); BMI is body mass index (kg/m2).

Correlation of BMI to total adipose tissue (TAT) (a) and to muscle mass (b) pre HD measurement, where TAT and muscle mass were measured by MRI.
Correlation of BMI to total adipose tissue (TAT) (a) and to muscle mass (b) pre HD measurement, where TAT and muscle mass were measured by MRI.
Study 2
N = 32, 16 m, 53.1 ± 15 years (429 measurements and 13.4 ± 8.9 measurements per patient). The average FO in the development model (n = 10) was FOBL = 3.01 ± 1 kg, FOStage2 = 2.1 ± 0.7 kg, FOStage3 = 0.96 ± 0.5 kg, and FODWcBIS = 0 and in the validation model (n = 22) was: FOBL = 1.8 ± 1.2 kg, FOStage2 = 1.15 ± 0.8 kg, FOStage3 = 0.54 ± 0.5 kg, and FODWcBIS = 0, respectively. Change in CNR significantly correlated at stage 1 (R2 = 0.33, p < 0.001), stage 2 (R2 = 0.36, p < 0.001) post-HD except at stage 3 where weight differences were small (0.54 ± 0.5 l). Blood pressure and heart rate did not differ significantly either pre or post HD during the study. However, SBP was low at BL (table 2).
The CNR nonlinear model for predicting dry weight was developed by best fitting experimental data in 10 patients as follows:
FOCNR = k * exp [-(CNRP - CNRH)n](1)
DWCNR = Post Wt - FOCNR(2)
where k = 0.35 in unit of l/Ω·m3/kg, n = 1/3 were obtained by the method of least error from the previously independently determined DWcBIS; CNRP and CNRH represent measurement in patients, and the threshold of the normal range in healthy subjects, respectively. The thresholds are 18.5 (10-2·Ω·m3/kg) in males and 19.1 (10-2·Ω·m3/kg) in females, respectively [19]. Figure 4a shows the difference between DWCNR as predicted by the model and the DWcBIS; figure 4b shows the results with 22 remaining patients in the application of this model (validation).
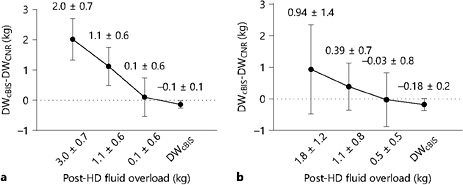
a Prediction of fluid overload by calf model (establishing model, n = 10) in different stages. b Prediction of fluid overload by calf model (validation model, n = 22) in different stages.
a Prediction of fluid overload by calf model (establishing model, n = 10) in different stages. b Prediction of fluid overload by calf model (validation model, n = 22) in different stages.
The difference between prediction and actual DWcBIS by the CNR model decreased (p < 0.0001) with reduction of fluid overload over stages (table 2). Bland-Altman analysis showed DWcBIS was overestimated by 2.03 ± 0.69, 1.13 ± 0.63, and 0.1 ± 0.64 l and by 0.94 ± 0.18, 0.39 ± 0.7, and -0.02 ± 0.8 l with the establishing model and validating model at three stages of FO, respectively (fig. 5).

Bland-Altman analysis for comparing predicted DW with CNR and DWcBIS in BL (a), stage 2 (b), stage 3 (c) and the last stage (d)DWcBIS in the validation group (n = 22).
Bland-Altman analysis for comparing predicted DW with CNR and DWcBIS in BL (a), stage 2 (b), stage 3 (c) and the last stage (d)DWcBIS in the validation group (n = 22).
Discussion
This original work shows two separate applications of calf bioimpedance: (1) its relationship with body composition as measured by gold standard dilution and MRI techniques. (2) development of a model to predict normal fluid status using an independent method (CNR) to initially establish the latter.
Why use Calf Measurements?
The fundamental requirement for accuracy of bioimpedance measurements is that the subject should be made of a cylinder with homogeneous conductivity in cross-sectional area [20]. Practically, we assume that the whole body can be modeled as an approximately ideal cylinder with uniform body composition so that distribution of current density is nearly identical in all cross-sectional areas. However, the equivalent resistance or impedance of this ideal cylinder can be altered significantly when distribution of fluid is changed between segments even when the actual fluid volume or body weight is unchanged [21,22,23].
The calf, however, as one segment of the body, provides an approximate cylinder with uniform body composition. In this study, calf circumference correlated with all total body components (table 1). These relationships make it possible to use one segment (calf) to predict total body fluid, fluid status, and body composition. For example, the correlation of the calf models with MMMRI is R2 = 0.85 and with TATMRI is also R2 = 0.85, which is much higher than it is with calf circumference, presumably, because the model includes intracellular calf resistance and body weight and height.
Why use CNR and not Volume-Related Parameters?
To compare fluid status in a population using absolute fluid volume is impossible because volume depends on body size and body composition partially related to fluid status. The CNR is the only parameter that correlates with the gold standard hydration marker (ECVBr/FFMMRI) and this is not influenced by the body composition so that this correlation is the basis of the model to describe the relationship between change in fluid volume and change in CNR using a nonlinear model to predict the normal fluid status. In addition, the correlation of CNR with ECVBr/FFMMRI post HD was better than pre-HD, which implies that the degree of hydration influence this relationship possibly because of segmental fluid distribution accompanying fluid overload.
Prediction of Dry Weight with a Nonlinear Model
This model has been established based on an exponential function of differences in CNR in individual patients, decreasing the levels of FO over time, FO, and the normal threshold of CNR. As fluid overload decreases, the difference between predicted DWCNR and DWcBIS was gradually reduced (fig. 4). This phenomenon may be explained by the shift of excess fluid from the intracellular to extracellular space during each stage of reduction of fluid overload.
Two major questions in clinical fluid management are: (1) how to determine normal fluid status (DW) and (2) how to reach the DW. Since treatment times in U.S. dialysis units are somewhat shorter than 4 h, a relatively high UFR is often used in order to remove interdialytic fluid gain with risk of hypotension before DW is attained [24]. Methods such as increase in dialysis time or frequency combined with excellent control of salt intake would be good strategies to help patients retain normal fluid status.
Limitations of the Study
The number of patients in the dry weight study was small. The use of DWcBIS for the estimation of DW needs a larger clinical study for further validation. The new model needs testing in a large variety of clinical dialysis situations.
Conclusion
This study demonstrates that calf bioimpedance is useful to predict body composition and normal fluid status (dry weight). Prediction of dry wright (DWCNR) with the calf normalized resistivity (CNR) model provides a new tool to manage fluid status in dialysis patients as well as in CKD patients.
Acknowledgments
The authors thank the staff at Roosevelt-St. Luke Hospital for performing the isotope dilutions, TBK and MRI measurements. We greatly appreciate the work of colleagues and research fellows who have participated in dry weight and body composition studies over time.
Disclosures
Dr. Levin holds stock in Fresenius Medical Care.
Appendix
1. CNR Calculation
Resistivity calculation

where R (Ω) is resistance at 5 kHz, which was extracted from the spectroscopic data, L (10 cm) is the length of measurement of segment, and A (cm2) is the average calf cross-sectional area. A can be calculated by calf circumference as follows:

where CMax and CMin are maximal and minimal circumferences at the sections of two measuring electrodes and r = (CMax + CMin)/(4π). Then resistivity can be presented by

Calf normalized resistivity (CNR) is defined as
CNR = Rho / BMI.(A-4)
where BMI (body mass index) is body mass (M, kg) divided by body height square (H2, m2).

In Eq A-5, unit of CMax, CMin, and L is in cm but H is in m and M in unit of kg, so unit of CNR is [10-2·Ω·m3/kg]. Since m3/kg = 1/(kg/m3) is inverse of density, the CNR unit can be explained as ohm per density.
2. Estimation of Body Composition using Calf Bioimpedance
MMCBM = -0.103 * cRi + 30.58 * Height + 0.159 * Weight - 0.098 * Age - 28.736,(A-6)
TATCBM = 0.13 * cRi - 0.142 * CA +2.43 * BMI + 0.129 * Age - 44.33(A-7)
where cRi is calf intracellular resistance (Ω), height is body height (m), weight is body mass (kg), and CA is calf cross-sectional area (cm2).
The post-HD gold standard hydration marker was defined as (ECVBr - UFV) / (Post HD Wt-TATMRI), where UFV is ultrafiltration volume in liter.
3. Prediction of Normal Fluid Status with the CNR Model
The ratio of change in total body extracellular fluid volume (d(wECV)) to change in calf ECV is assumed to be proportional when fluid is reduced to normal fluid status. This process can be described as follows:
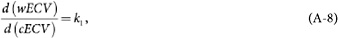
where k is a non-dimensional constant. The equation A-8 can be rewritten as:
d (wECV) = k1 * d (cECF).(A-9)
Integrating both sides the solution to the above equation (A-9) is:
ΔwECV = k1 * cECV.(A-10)
where ΔwECV represents the body fluid overload (FO); ΔcECV represents calf excess fluid volume which can be approximately represented by k2 in the unit of L.
ΔwECV = k1 * (k2 exp [-ΔCNRn])(A-11)
FO = K * exp [-(CNRP - CNRH)n],(A-12)
where CNRP and CNRH represents measurements in patients and at the threshold of a healthy population respectively, K is a constant (K = k1 * k2) in unit of L, and n is a non-dimensional constant. The values of K and n are obtained by calibration using experimental data.
The normal fluid status (DW) can be calculated by determining the difference between post HD weight (WtPostHD) and FO as follows:
DW = WtPostHD - FO.(A-13)
