

Abstract
Background/Aims: Delivered dialysis therapy is routinely measured in the management of patients with end-stage renal disease; yet, the quantification of renal replacement prescription and delivery in acute kidney injury (AKI) is less established. While continuous renal replacement therapy (CRRT) is widely understood to have greater solute clearance capabilities relative to intermittent therapies, neither urea nor any other solute is specifically employed for CRRT dose assessments in clinical practice at present. Instead, the normalized effluent rate is the gold standard for CRRT dosing, although this parameter does not provide an accurate estimation of actual solute clearance for different modalities. Methods: Because this situation has created confusion among clinicians, we reappraise dose prescription and delivery for CRRT. Results: A critical review of RRT quantification in AKI is provided. Conclusion: We propose an adaptation of a maintenance dialysis parameter (standard Kt/V) as a benchmark to supplement effluent-based dosing of CRRT. Video Journal Club “Cappuccino with Claudio Ronco” at http://www.karger.com/?DOI=475457
Introduction
Delivered dialysis therapy is routinely measured in the management of patients with end-stage renal disease (ESRD) and urea-based quantification tools validated in prospective clinical trials are widely available to clinicians [1]. Despite these measures, the quantification of renal replacement delivery in acute kidney injury (AKI) is less established [2,3,4]. Although the advent of continuous renal replacement therapy (CRRT) highlighted its hemodynamic benefits relative to conventional HD [5,6], early kinetic studies employing adaptations of maintenance dialysis approaches also demonstrated the unique and specific advantages of CRRT with respect to urea clearance and azotemia control [7,8,9]. Additional kinetic comparisons have also indicated that CRRT has advantages over conventional HD with respect to the removal of solutes over a broad molecular weight range [10,11].
While the greater solute clearance capabilities afforded by CRRT relative to intermittent therapies are generally recognized by clinicians, neither urea nor any other solute is specifically employed for CRRT dose assessments in clinical practice at present. Instead, the landmark trial performed by Ronco et al. [12] has established effluent-based dosing as the standard of care for CRRT. It should be emphasized that prior to this publication, no clinically validated dose measurement for CRRT existed.
Although the normalized effluent rate remains the gold standard for CRRT dosing in clinical practice [13], this parameter does not provide an accurate estimation of actual solute clearance. This situation has created considerable confusion among clinicians, especially among those familiar with urea-based dose measurements in the maintenance dialysis setting. To address this problem, in this study, we reappraise dose prescription and delivery for CRRT and propose an adaptation of a maintenance dialysis parameter (standard Kt/V) as a benchmark to supplement effluent-based dosing of CRRT. Prior to this, a critical review of RRT quantification in AKI is provided.
Use of Clearance to Quantify Dose in Renal Replacement Therapy
Overview of Clearance
The concept of solute clearance is integral to therapy dose in maintenance dialysis. Based on work performed originally in the renal physiology field, solute clearance (mL/min) is defined as the ratio of mass removal rate (N) to blood concentration (CB) [14]:
K = N/CB(1)
When solute clearance is estimated with this equation, typically a steady state is assumed, implying that net solute generation is balanced by net removal. For continuous depuration processes (e.g., endogenous kidney function), the indexing of mass removal rate to blood concentration allows for patients with widely varying kidney function to be compared with the same standard.
Adaptation of the clearance concept to maintenance dialysis for ESRD patients occurred nearly 40 years ago as a way to quantify delivered HD dose, with urea used as a surrogate molecule generally representative of uremic toxicity [15]. Various urea kinetic modeling (UKM) techniques were proposed, all based on the assumptions of a quasi-steady state for the patient and the validity of a single measurement being representative of dialysis delivery over an extended period of time (e.g., month) [16,17,18]. The common element of most of these approaches is the use of urea Kt/V (K, urea clearance; t, dialysis time; V, urea distribution volume) as the operative dose measurement, with V serving as a rough approximation of total body water (TBW). Urea Kt/V is a dimensionless parameter typically derived from pretreatment and posttreatment blood urea nitrogen (BUN) values around a specific treatment [16], along with other treatment-related (e.g., ultrafiltration volume) and patient-related (e.g., body weight) parameters. According to consensus guidelines, a delivered urea Kt/V of 1.4 per treatment (for patients who receive thrice-weekly maintenance HD therapy and have low residual native kidney function) is considered adequate [19]. It is worthwhile to note that UKM is also employed to quantify delivered dose for ESRD patients treated with peritoneal dialysis (PD). However, in this case, urea Kt/V is estimated by the use of a direct quantification technique in which effluent dialysate is collected over a specific period of time [20].
What Clearance?
Surrogate Molecule Considerations
Although its basic definition is straightforward, the variable application of clearance to quantification of maintenance dialysis has several important implications. First, as mentioned above, the exclusive use of urea for kinetic modeling and dosing raises several questions. On the one hand, the kinetics of urea removal is relatively well understood for different dialysis modalities and the molecule is easily measured in clinical practice. Moreover, while its actual toxicity is a matter of debate, urea is considered a good surrogate for the “small solute” uremic class, which consists classically of highly water-soluble, nitrogenous waste products. On the other hand, large randomized trials in both the maintenance HD [21] and PD [22] populations have cast a doubt on the actual toxicity of this solute class in ESRD patients and given credence to the potential importance of other uremic toxin classes [23,24].
Instantaneous vs. Treatment Clearance
Another consideration is the myriad different clearance determinations available to the clinician [25]. On a very general level, the various clearance expressions can be divided into instantaneous and time-averaged (treatment) categories. Instantaneous clearance is considered the gold standard for the technical assessment of a filter, whether used in the ESRD or AKI realm. As the name suggests, the estimation of instantaneous clearance involves the measurement of solute concentrations at a specific time during a dialysis treatment. For filters used in conventional HD, simultaneous measurements of the “arterial” (incoming) and “venous” (outgoing) blood along with other parameters (e.g., blood flow rate) allow this determination to be made. In this case, the therapy's relatively high efficiency (at least with respect to removal of low-molecular weight solutes) leads to a substantial arteriovenous difference in blood solute concentrations. This gradient represents the degree to which solute extraction from the blood occurs and is the basis for the calculation of the numerator in equation (1).
On the other hand, treatment clearance is more commonly used in clinical practice to characterize the overall therapy efficacy for both HD and PD. As suggested above, the standard of care for estimating delivered maintenance HD dose involves the determination of urea Kt/V, most commonly with the following equation [17]:
Kt/V = -ln (R -0.008·t) + (4 - 3.5·R) (UF/W)(2)
where R is posttreatment/pretreatment BUN ratio, t is treatment time (h), UF is net ultrafiltration (L), and W is post-treatment body weight (kg). In this approach, urea clearance (K) is not estimated as an individual parameter but rather as part of the entire dose expression (Kt/V). (The term involving treatment time accounts for intradialytic urea generation.) Since this equation was developed for and validated in maintenance HD patients, its relevance to critically ill AKI patients can be questioned, since intradialytic urea generation and ultrafiltrate volumes may be substantially different in this latter population.
By definition, a treatment clearance used for conventional HD acknowledges that solute kinetics in body compartments outside the vascular space are typically rate-limiting with respect to net solute removal (rather than depuration rate in the extracorporeal filter) [26]. An obvious corollary to this observation is the requirement that solutes first have to appear in the vascular compartment for extracorporeal removal to occur, since only blood (and not fluid from other body compartments) is delivered to the filter. Of note, these considerations apply to conventional HD and other high-efficiency therapies but not necessarily to lower efficiency therapies, such as PD and CRRT, in which a significant difference in inter-compartment and extracorporeal solute transfer rates does not exist.
The operating conditions during CRRT lead to a different set of considerations. A defining characteristic of CRRT is the reduced rate at which solute and net fluid removal occur in comparison to conventional HD. The relatively low efficiency of CRRT renders unhelpful blood-side instantaneous clearance determinations because blood passage through the filter does not produce substantial differences between the incoming and outgoing blood concentrations. Thus, when an instantaneous clearance is determined for a CRRT filter, effluent measurements (product of the flow rate and solute concentration) are used to estimate the numerator of equation (1) [27]. (See below for further instantaneous clearance assessments for different CRRT modalities.)
Similar to conventional HD, a treatment clearance also can be estimated for CRRT. In this case, a direct quantification approach in which the numerator of equation (1) is estimated by measuring solute concentration in a volume of effluent collected over a specific time is used [28]. In this way, a time-averaged clearance over the specified time period is provided.
Relationship between Solute and Mass Removal Rate for Different Modalities
While not readily evident by inspection of equation (1), the relationship between solute removal and clearance is therapy-specific. This issue has been evaluated critically by several investigators, including Clark and Henderson [29]. Assuming constant urea clearance, these investigators have demonstrated that while conventional HD's relatively high efficiency results in a high urea mass removal rate early in a treatment, this rate decreases substantially as the transmembrane concentration gradient for removal is dissipated due to falling blood concentrations (Fig. 1). As such, cumulative solute removal begins to reach a plateau later in treatment, leading to a “self-defeating” situation for the removal of solutes eliminated efficiently during conventional HD.
![Fig. 1. Relationship between the mass removal rate and clearance for a high-efficiency dialysis modality used for end-stage renal disease (left) and CRRT used for AKI (right). Adapted from [29]. Reprinted with permission from [29].](https://karger.silverchair-cdn.com/karger/content_public/journal/bpu/44/2/10.1159_000475457/2/m_000475457_f01.jpeg?Expires=1716296434&Signature=IwnXmvmvOWbB-u~uDhPI-gl5Xmt2JnOglhCFRRWnOFf8FVqMkdwtB-7-An~fXXial7v6VPUjegVDoxhsaUEGyQ6lRvFOraT8swzZRp2kb~Dlg2Zq6gFeF2doWOXbociGRmhVGmMGmkfgtpOpvyXvtbSCMXhupFPVt4ahaJ~I2pRHm3ykE-bXlH5q3NmGzI-dUz8pWrMP~-JjkbK6dO8YCmWDzttqXv6F8V9CKEzotq~EavRkgGyEj8f4VGpzsRm~cQ4hTmINbpfOUgIhaGo~x~nrLk7-F9Sei7K9LZd04PXS6wpaTpZL7~v18Jh23ivsGnsKuwqD0-rCnbBM~a0xsg__&Key-Pair-Id=APKAIE5G5CRDK6RD3PGA)
Relationship between the mass removal rate and clearance for a high-efficiency dialysis modality used for end-stage renal disease (left) and CRRT used for AKI (right). Adapted from [29]. Reprinted with permission from [29].
Figure 1 also demonstrates the same relationship between urea mass removal rate and instantaneous clearance for a CRRT filter operated at a steady state (i.e., constant clearance and urea generation rate with a constant BUN as a result). In this case, the mass removal rate also remains constant, leading to a linear increase in cumulative solute removal over time. It should be emphasized here that while the assumption of constant clearance for the relatively short period of a conventional HD treatment is reasonable and even expected, it is less certain during CRRT for a variety of patient-related and treatment-related reasons (see below).
Attempts to Use a Single Clearance Expression for Different Dialysis Therapies
Unified clearance expressions designed to quantify solute removal by therapies ranging from conventional (thrice-weekly) HD to continuous therapies have been proposed. These approaches include equivalent renal clearance [30] and standard urea clearance [31]. In different ways, these methodologies attempt to incorporate the effect of “intermittence” on treatment efficiency and actual solute removal. As suggested above, the differences in solute removal rates early vs. late during an intermittent treatment (despite constant clearance) do not allow direct comparison of Kt/V values derived, for example, from a 2-h treatment and a 4-h treatment. Likewise, the direct comparison of the dose provided by intermittent and continuous therapies is not straightforward.
The equivalent renal clearance (EKR) is an example of a unified clearance expression defined as the ratio of solute generation rate (G) to either the steady-state solute concentration (for a continuous therapy) or the time-averaged concentration (for a semi-continuous/intermittent therapy) (C):
EKR (mL/min) = G (mg/min)/C (mg/mL)(3)
However, the EKR methodology is not suitable for clinical practice as neither G nor C is typically measured. The standard Kt/V methodology is another “continuous-equivalent” approach in which effective clearances provided by various intermittent schedules are referenced to a weekly continuous Kt/V provided by PD. While these approaches were developed originally for maintenance dialysis, they have also been applied to the spectrum of renal replacement therapies used in AKI [11,32,33]. (The application of standard Kt/V to CRRT is discussed later in the review.)
Finally, dialysis quantification parameters other than clearance are also important to consider. While clearance is a representation of treatment efficiency at a specific time or over a relatively limited time period, intensity can be defined as the product of clearance and cumulative treatment time. This parameter can be employed to demonstrate that despite relatively low solute clearance rates, cumulative solute removal with CRRT is typically much greater in comparison to more efficient therapies delivered intermittently. Finally, efficacy measures the effective removal of a specific solute resulting from a given treatment in a given patient. Efficacy can be numerically defined as the ratio of intensity to volume of distribution for a specific solute - urea Kt/V is an efficacy parameter. A recent consensus publication regarding nomenclature used for acute RRT therapies reinforces these concepts [34].
Quantification of Dialysis Dose in Maintenance Hemodialysis: Lessons Learned
After its original description in 1974, UKM was used to guide therapy prescription in the National Cooperative Dialysis Study (NCDS), performed in the United States [35]. In this original description applied to ESRD patients receiving regular HD (“formal” UKM), 3 successive BUN measurements (pre- and posttreatment values around one session and pretreatment value for the subsequent session) along with other treatment data (e.g., treatment time and dialyzer urea clearance) are used to estimate urea distribution volume (V) and protein catabolic rate (PCR) by use of an iterative computer algorithm. In turn, these latter parameters act as inputs to the algorithm, ultimately providing Kt/V for a specific dialysis regimen. Thus, the major outputs from a formal UKM analysis are V, PCR, Kt/V, and time-averaged BUN. Because the rates at which urea generation and protein catabolism occur are directly proportional, an interrelationship exists such that time-averaged azotemia control is proportional to the ratio of PCR to Kt/V.
One of the fundamental assumptions of UKM when applied to maintenance HD is the existence of a reasonably stable patient in a quasi-steady-state condition - this has several important corollaries. First, a steady-state condition implies that the time period during which the BUN determinations for UKM are made is representative of the patient's condition over time and allows for a time-averaged BUN to be estimated. In this equilibrium state, PCR is also assumed to be equivalent to dietary protein intake - in other words, net anabolism is equivalent to net catabolism. Thus, as mentioned previously, a steady-state UKM analysis provides estimates of therapy efficacy (Kt/V), nutritional status (PCR), and metabolic control (time-averaged BUN). However, the interrelationship noted above precludes the evaluation of any single parameter in isolation. For example, a relatively low time-averaged BUN in a maintenance dialysis patient may be the result of an aggressive treatment regimen (high Kt/V), poor nutritional status (low PCR), or combination thereof. Finally, it is erroneous to view these parameters as being related simply on a mathematical basis. For example, a common clinical intervention for a patient with a low BUN considered attributable to inadequate dietary protein intake is an intensification of the dialysis regimen (i.e., increase in Kt/V) to mitigate the potential effect of uremia on appetite suppression.
In the NCDS trial, HD prescription on an individualized basis resulted in patient groups having low (50 mg/dL) or high (90 mg/dL) time-averaged BUN target values [36]. The original analysis demonstrated higher morbidity among patients in the high BUN target group. While this original publication did not report formal UKM parameters, a subsequent analysis suggested that a delivered Kt/V of 1.0 per treatment and a normalized PCR of 1.0 gm/kg/day constituted “adequate” therapy (in patients receiving standard thrice-weekly therapy), with no apparent benefit for higher HD dose [37].
Several years later, simplified UKM techniques incorporating 2 BUN measurements, with a delivered Kt/V of 1.0 as the dose target were introduced into American clinical practice. However, at the same time, a disturbing increase in the gross mortality rate among maintenance HD patients was observed [38], raising the possibility that UKM-guided prescription had resulted systematically in inadequate dialysis. Indeed, several reports indicated that while the NCDS conclusions focused on a delivered Kt/V of 1.0 per treatment, clinicians frequently prescribed therapy according to this target, neglecting the possibility that shortfalls in the delivery of the prescribed dose commonly do occur [39,40,41]. Moreover, while this concerning trend was developing, a reappraisal of the NCDS data by Keshaviah [42] suggested delivery of Kt/V values greater than 1.0 per treatment was in fact associated with improved clinical outcomes. Several large observational studies published in the mid-1990s corroborated this finding [43,44,45,46]. These results, along with those of a large randomized American study (HEMO trial) [21], provided the basis for the delivered Kt/V target of 1.4 per treatment (minimum, 1.20) for patients treated thrice-weekly [19].
From a historical perspective, the application of UKM to guide the prescription and delivery of maintenance HD provides several valuable lessons. First, even though the NCDS was an important milestone in maintenance HD therapy, it was a relatively small trial (n = 151) from which conclusions heavily influencing clinical practice were drawn without the support of corroborating data. Second, while the reappraisal of the NCDS data raised questions about the original analysis, it may have occurred only after systematic under-dialysis became entrenched at many American dialysis facilities. A final pitfall was the mistaken notion that a single parameter (Kt/V) could define “adequate” therapy in response to the NCDS data. Instead, as is the case for RRT in AKI, such a definition has to consider many aspects and the prescribed/delivered RRT dose is but one element.
Quantification of RRT Dose in AKI versus ESRD: Important Distinctions
As noted, a fundamental assumption of UKM when applied to maintenance HD patients is the existence of a quasi-steady state. This assumption is clearly not applicable in critically ill AKI patients, whose clinical status changes on a daily or even hourly basis. As such, the application of UKM to the AKI population needs to be done with caution for several reasons. First, the steady-state relationship between PCR and dietary protein intake in maintenance HD patients is clearly invalid for critically ill AKI patients. Nevertheless, UKM may provide an estimate of the degree of hypercatabolism and net negative nitrogen balance, both of which are characteristic of the critically ill AKI population [47,48,49,50]. Second, another fundamental component of UKM, urea distribution volume (V), is frequently deranged in the AKI population [51,52] and assumptions for this population based on values typical for ESRD patients may dramatically underestimate the degree of volume expansion. Moreover, the failure to consider the possibility of increased distribution volumes in AKI patients may lead to substantially reduced removal of water-soluble compounds (e.g., urea) relative to expected values [53].
Shortfalls in the delivery of the prescribed RRT dose that occur in maintenance HD are typically caused by vascular access-related problems or reduced treatment time (e.g., treatment termination due to hypotension). On the other hand, differences between prescribed and delivered dose not only occur more commonly in acute RRT but also are typically of greater magnitude. Therefore, frequent patient assessment from both a clinical and kinetic perspective is required to minimize these differences, consistent with the principle of “dynamic CRRT” (see below).
Quantification of Dialysis in AKI: Intermittent Therapies
In an observational study published in 1996, Paganini et al. [54] were the first to explore the relationship between delivered Kt/V and outcome in a series of AKI patients who received RRT at the Cleveland Clinic. Of the total 842 patients included, 417 patients received only HD and an additional 242 received a combination of HD and CRRT. The second-generation Daugirdas formula (equation 2) was employed for determining the delivered Kt/V per HD treatment. In a comparison of surviving and nonsurviving patients, the investigators found significant differences between the mean prescribed and delivered Kt/V in both groups (surviving: 1.06 ± 0.0.04 vs. 0.90 ± 0.0.04, p = 0.004; nonsurviving: 0.94 ± 0.0.06 vs. 0.76 ± 0.0.05, p = 0.018). Moreover, the difference in delivered dose between the surviving and nonsurviving groups was significant (p = 0.035). For patients treated with conventional HD, those receiving a relatively high delivered dose (Kt/V >1.0 per treatment) had a significantly higher hospital survival than patients receiving a lower dose. When hospital survival was expressed as a function of baseline illness severity (as measured by the Cleveland Clinic Foundation ICU ARF score) [55] and stratified by dose, the survival difference between the low and high K/V groups was found to be in the intermediate illness severity range (Fig. 2).
![Fig. 2. Survival as a function of baseline illness severity in AKI patients treated with conventional hemodialysis. CCF, Cleveland Clinic Foundation. Reprinted with permission from [4].](https://karger.silverchair-cdn.com/karger/content_public/journal/bpu/44/2/10.1159_000475457/2/m_000475457_f02.jpeg?Expires=1716296434&Signature=b2WgG79nUBqVIei8CSncLL38bObBzjJCoccbYQRNsuH9tdNU37bzEZfX-OfEXiDcU8kGU0n1d1bZyBE5X-w5sGtmay85JWO6KiTUD6ltr~PzKIN~07bM-71Lls2xEBj9EDfT9h1Eeu9PC3SMc1mo3zUqtMSxW3jJrvAZo6VUJeSMQxmVpB7Pj4lJRehho~gDNvLCjCoHX~U504eNoan18iotH6Vl2SNlUW4JxNKWV00wLDJlddDK9eUQymFNRJNKDtmSFokMguGqDxQF1cGbsC--OxxzqmQeV-uwcQeBzJa3zI6XE89AYoQFKK0YfjOpsHBLOCCthf7LLVGBEyXHdg__&Key-Pair-Id=APKAIE5G5CRDK6RD3PGA)
Survival as a function of baseline illness severity in AKI patients treated with conventional hemodialysis. CCF, Cleveland Clinic Foundation. Reprinted with permission from [4].
Survival as a function of baseline illness severity in AKI patients treated with conventional hemodialysis. CCF, Cleveland Clinic Foundation. Reprinted with permission from [4].
In a study involving 40 patients who received 136 HD treatments, Evanson et al. [56] further quantified differences between prescribed and delivered HD in AKI. While UKM was used to estimate both prescribed and delivered doses, the former was derived from separate estimates for dialyzer urea clearance (based on previously determined in vivo values for the dialyzers used) and V. Urea distribution volume was assumed to be 55% of body weight in females and 60% of body weight in males. Delivered HD dose was estimated by a relatively simple equation based on the degree of intradialytic BUN reduction. The authors acknowledged that this approach did not account for the contribution of ultrafiltration (convection) to overall urea clearance. Moreover, it was not clear whether this simplified equation accounted for intradialytic urea generation.
For the entire patient group, a significant difference was observed between prescribed and delivered Kt/V doses (1.25 ± 0.0.47 vs. 1.04 ± 0.0.49, respectively; p < 0.01). This outcome was attributed largely to differences between prescribed and actual blood flow rate. Using a Kt/V of 1.2 per treatment as a minimum criterion, the investigators found that 68% of treatments did not reach this threshold from a delivery perspective. In fact, the prescribed Kt/V did not even meet this target in 49% of treatments. In addition to inadequate blood flow rate, large body weight and the failure to prescribe anticoagulation were important factors contributing to lower dose delivery. In a subsequent study involving more detailed kinetic analyses, this investigative group confirmed the large discrepancy between prescribed and delivered Kt/V (1.11 ± 0.0.32 vs. 0.96 ± 0.0.33, respectively; p < 0.0001) for AKI patients treated with HD [57].
Schiffl et al. [58] subsequently assessed a small group (n = 72) of ICU AKI patients randomly assigned to receive either daily or alternate-day HD. The estimation of prescribed Kt/V was similar to the approach used by Evanson et al. [56], with a minimum target of 1.2 per treatment. For estimating delivered Kt/V, the second-generation Daugirdas equation was again employed. Results of the kinetic analyses from this trial are shown in Table 1. Similar to the above 2 studies, the delivered HD dose was significantly less than the prescribed HD dose (p < 0.001 for both groups). While the overall mortality (at 14 days after the last HD treatment) for the entire population was relatively low, patients in the daily HD had a significantly lower mortality than those in the alternate-day group (21 vs. 47%; p< 0.05). Moreover, mortality was significantly higher in patients with a cumulative (weekly) Kt/V <3.0 in comparison to patients with a cumulative Kt/V >6.0 (57 vs. 16%, respectively; p< 0.05).
Treatment parameters in trial comparing different regimens of conventional hemodialysis patterns for patients with AKI*
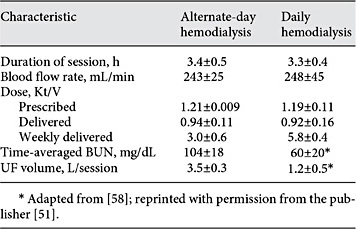
While this study was an important advance, 3 points are worth mentioning. First, for reasons mentioned previously, simply adding individual treatment Kt/V values to derive a weekly Kt/V actually underestimates the kinetic benefits provided by the daily regimen. Second, while multiple regression identified oliguria, APACHE III score, and sepsis (along with HD frequency) as independent factors influencing mortality, other potentially important factors influencing treatment delivery, such as hemodynamic instability and vascular access dysfunction, apparently were not assessed in a rigorous way. Finally, while concern was raised about potential scientific misconduct during this trial [59], the publishing journal eventually removed the expression of concern after an institutional investigation demonstrated no conclusive proof [60].
Faulhaber-Walter et al. [61] performed the first RCT comparing different doses of sustained low-efficiency dialysis (SLED) in a group of 156 critically ill patients. Serum urea nitrogen concentration was employed as a surrogate for treatment intensity, with the standard and intensified dose groups having target BUN values of approximately 55-70 and <40 mg/dL, respectively. After 7 days of RRT, the differing treatment intensities led to mean BUN values in the standard and intensified dose groups of approximately 60 and 35 mg/dL, respectively (p < 0.001). Nevertheless, survival at neither 14 nor 28 days after RRT initiation was significantly different between the 2 groups - likewise, renal recovery at 28 days was not significantly impacted.
Even though data establishing a clear relationship between delivered Kt/V and outcome were relatively limited at the time, the Acute Renal Failure Trial Network (ATN) trial protocol incorporated UKM to guide therapy prescription and delivery of intermittent modalities [62]. In this trial, delivered Kt/V target per treatment for both conventional HD and SLED based on the second-generation Daugirdas formula was 1.2, while the prescribed target was 1.4. Baseline V was assumed to be 55% of body weight - if necessary, this value was adjusted upward by assuming any acute weight increase from baseline was related to fluid accumulation.
Randomization in the trial was according to intensity of therapy and within each group, modality allocation was based on a patient's hemodynamic status. Relatively hemodynamically stable patients (cardiovascular SOFA score 0-2) [63] were treated with conventional HD, while unstable patients could be treated either with CRRT or SLED. A total of approximately 5,000 HD treatments were provided at an average frequency of 5.4 and 3.0 treatments per week (9.3 ± 7.1 and 5.5 ± 3.7 treatments per patient overall) in the intensive and less-intensive groups respectively. Beyond the first treatment, the mean delivered Kt/V per treatment was approximately 1.3 in both groups, with an average value greater than 1.2 delivered in approximately 70% of patients with multiple treatments.
Overall, the azotemia control was very good, with mean pre-dialysis BUN values of 45 ± 25 and 70 ± 33 mg/dL reported for the intensive and less-intensive groups respectively. However, this degree of control could be achieved only with regimens requiring blood flow rates (mean, 360 mL/min) and treatment durations (median, 4 h) that clinicians may not be willing or able to prescribe consistently.
With respect to the very small number of SLED treatments provided in the trial (299; 2.6% of all treatments), the median treatment duration was approximately 8 h. Mean blood and dialysate flow rates were 210-220 and 240-250 mL/min respectively. While the target for delivered Kt/V was 1.2 per treatment, the mean values achieved in the trial were not provided in the paper. In a previous study of 9 patients performed by Marshall et al. [33], the standard SLED prescription included blood and dialysate flow rates of 200 and 100 mL/min, respectively, along with a treatment duration of 12 h and frequency ranging from 4 to 7 treatments per week. Estimates for delivered Kt/V obtained from different kinetic analyses ranged approximately from 1.25 to 1.45 per treatment.
Due to the design of the ATN trial and the large percentage of patients treated with both an intermittent and continuous therapy during their AKI course, patient outcomes could not be correlated either with a specific modality or the dose delivered with it [64]. Moreover, as mentioned previously, the study protocol mandated that patients treated with HD to be less critically ill than those treated with other modalities. Nevertheless, largely based on the results of this trial, the KDIGO AKI Clinical Practice Guideline recommends delivery of a weekly Kt/V of 3.9 when intermittent treatments are applied [13]. For patients treated thrice weekly, this corresponds to a delivered Kt/V of 1.3 per treatment.
The Dose Response Multicentre International (DO-RE-MI) collaborative initiative applied the same categorization of intensive vs. less intensive dose in an observational trial analyzing the application of different modalities of acute RRT in clinical practice [65]. The study involved 30 ICUs in 8 countries, with patient enrollment occurring from 2005 to 2007. Of the 553 patients studied, 88 received intermittent therapy only, while 46 received intermittent therapy plus CRRT or another modality (e.g., plasmapheresis). Sixty four percent of patients received intensive therapy, defined as 6 or more intermittent treatments per week and, within this group, more than 90% received daily treatments. The median intermittent treatment duration was 5.5 h, suggesting that both conventional HD and SLED were prescribed in the study, and the median prescribed Kt/V was 1.2 per treatment. No significant association between RRT dose and patient outcome was reported.
Quantification of Dialysis in AKI: Continuous Therapies
Use of Urea Kinetics to Estimate CRRT Dose
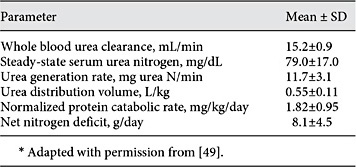
The first formal assessment of urea kinetics for CRRT was performed by Clark et al. [49] in AKI patients treated with pre-dilution CVVH at a relatively low dose according to contemporary standards. Estimates of V along with urea generation rate, PCR, and nitrogen balance were provided (Table 2). In a separate report from the same group, normalized PCR was found to increase steadily during the course of CRRT from an initial mean value of 1.55 ± 0.14 g/kg/day on day 1 to 1.95 ± 0.15 g/kg/day on day 6 [8]. The latter findings, corroborated by other investigators [47,48,50], confirmed the pronounced hypercatabolism and nitrogen deficits characteristic of this population. These investigators extended their analysis by applying formal UKM to estimate delivered dose for the same group of CRRT patients in comparison to a separate group treated with conventional HD [9]. While the mean delivered Kt/V per day was the same in both groups (0.59 ± 0.23 vs. 0.59 ± 0.20 in the CRRT and HD groups, respectively), the mean steady-state BUN in the CRRT group was significantly lower than the mean peak BUN in the HD group (79 ± 17 vs. 101 ± 12, respectively; p < 0.05).
Urea kinetic parameters for critically ill, acute kidney injury patients treated with continuous venovenous hemofiltration*
Leblanc et al. [7] also characterized CRRT efficacy with urea Kt/V as a dose parameter in a series of 25 patients. Based on an assumed V of 55% of body weight, delivered Kt/V was calculated for different continuous therapies and compared to that provided by conventional HD. Daily mean delivered Kt/V values for the CRRT modalities ranged from 0.88 to 2.03, depending on the specific combination of dialysate flow and ultrafiltration rates prescribed. For example, CVVHD applied with a dialysate flow rate of 1 L/h and mean ultrafiltration rate of 1.1 L/h resulted in a mean delivered Kt/V of 1.14 ± 0.25 per day or Kt/V of 8.0 per week. (Based on the mean values for the parameters provided, the corresponding effluent-based CRRT dose can be estimated to be approximately 26 mL/kg/h.) On the other hand, delivered Kt/V per conventional HD treatment (urea clearance, 175 mL/min) was 1.07 on a mean basis. In reference to the specific CVVHD protocol described above, a simple summation of daily Kt/V values would suggest approximate equivalence between it and daily HD. However, as suggested previously, such a comparison does not account for the inherent inefficiency of intermittent therapies, so this comparison is not valid.
Other approaches developed originally for maintenance dialysis have also been applied in the evaluation of CRRT dosing [11,32]. Claure-Del Granado et al. [32] have reported CRRT dose parameters, including EKR and urea Kt/V, in a series of 52 patients. They estimated both blood-side and effluent-side parameters on an instantaneous basis from simultaneous urea nitrogen concentration determinations, accounting for treatment downtime. Urea clearance estimated from EKR and effluent-side UKM correlated well with clearance estimated by the reference method of effluent collection (i.e., direct quantification).
Dose/Outcome Studies
Ronco et al. [12] utilized normalized effluent rate as a novel dosing parameter to demonstrate that survival in patients prescribed doses of 35 or 45 mL/kg/h of post-dilution CVVH was significantly higher than in those prescribed a dose of 20 mL/kg/h. The rationale for this dosing approach was the well-described direct relationship that exists between the effluent rate and urea clearance in this modality as long as filter function is preserved. In other words, in the context of post-dilution hemofiltration, there is a 1:1 relationship between doses based on effluent rate and urea clearance as long as filtration fraction and hemoconcentration are managed appropriately.
Subsequent to the Ronco et al. [12] trial, several additional single-center randomized clinical trials assessed the relationship between effluent-based dose and outcome [66,67,68]. These trials, which employed a broad spectrum of CRRT modalities, produced inconsistent results. Furthermore, none incorporated detailed urea kinetic analyses. Among randomized CRRT dose/outcome studies, the ATN trial was the first one that was conducted on a multi-center basis [62]. Between the 2 dose arms, a total of almost 6,000 CRRT treatments were provided in the study, representing 56% of all renal replacement treatments. Because the CRRT doses of 35 and 20 mL/kg/h were delivered with pre-dilution CVVHDF at a mean blood flow rate 140-150 mL/min, the urea clearance-based dose was approximately 29 and 17 mL/kg/h, respectively, on a delivered basis. The average effluent volumes per day in the intensive and less-intensive groups were approximately 50 and 30 L, respectively, with dialysate (diffusion) and replacement fluid (convection) given in equal volumes. The primary endpoint, all-cause mortality 60 days after the initiation of the renal replacement therapy, did not differ between the intensive and less-intensive groups. The design of the trial, in which RRT assignment was based on hemodynamic status, does not allow the effect of CRRT on outcome to be isolated because most patients were treated with more than modality [64].
The design of the RENAL trial, which was the second multi-center AKI dose/outcome trial, differed substantially from that of ATN [69]. In RENAL, all patients were initially treated with CRRT and only a small percentage had any exposure to HD while in the ICU. For all practical purposes, therefore, RENAL was exclusively a CRRT dose/outcome trial. The treatment modality was post-dilution CVVHDF, prescribed at doses of 25 or 40 mL/kg/h. Mean delivered effluent doses were reported to be 33.4 and 22 mL/kg/h in the higher-intensity and lower-intensity groups respectively - these values correspond to 84 and 88% delivery of the prescribed dose. Similar to ATN, no significant difference in all-cause mortality 90 days after initiation of CRRT was observed between the 2 dose groups.
Based on the series of randomized controlled trials (especially ATN and RENAL), the KDIGO AKI Clinical Practice Guideline recommends delivery of an effluent dose of 20-25 mL/kg/h in CRRT [13]. Since that time, 2 additional RCTs focused on the potential clinical benefit of “high-volume CRRT” specifically in septic AKI patients have been published [70,71]. In these studies, the CRRT dose prescribed to the control groups was in the range evaluated in the 5 RCTs previously discussed (20-45 mL/kg/h) while the prescribed doses in the intervention groups were 70 mL/kg/h [70] and 80 mL/kg/h [71]. However, neither of studies demonstrated a survival benefit for high-volume CRRT.
Finally, a very recent Cochrane systematic review has provided an updated compilation of the evidence with respect to the influence of CRRT intensity on mortality, renal recovery, and other important clinical outcomes [72]. The analysis concluded that despite the inclusion of data from 2 relatively large multicenter RCTs, the overall quality of evidence is relatively weak. Based on the available evidence, more intensive CRRT was not found to have a favorable impact on mortality or renal recovery. Nevertheless, the evidence does indicate that intensive CRRT is associated with a lower mortality risk specifically in the subset of patients with post-surgical AKI. On the other hand, more intensive CRRT is also associated with a greater risk of hypophosphatemia.
Prescribed versus Delivered CRRT Dose
The above KDIGO consensus statement regarding delivered CRRT dose [13] includes a caveat that prescribed dose needs to be higher than the delivered dose target in most instances. Indeed, available data suggest that shortfalls in the delivery of the prescribed CRRT dose are common even in the setting of clinical trials and may be substantial in clinical practice. For the sake of clarity, the actual failure of the delivered effluent dose to match the prescribed effluent dose should be differentiated from diminutions in the effective dose (i.e., solute clearance). Pre-dilution is primarily responsible for the latter and some trials employing CRRT in this mode have made reference to this phenomenon.
In the series of randomized CRRT dose/outcome trials, greater than 80% of the prescribed dose was delivered on average [12,62,66,67,68,69]. However, in some trials, interventions not typically made in general clinical practice occurred in order to preserve dose delivery. For example, when shortfalls in treatment delivery occurred on a particular day in the Ronco et al. [12 ]trial, compensatory dose increases could be made on the following day. Furthermore, filter changes occurred routinely every 24 h according to institutional practice.
Other trials performed outside the relatively controlled environment of a randomized controlled trial have been less sanguine. In an early study, Venkataraman et al. [73] retrospectively evaluated 115 CRRT patients treated during 1999-2000. The mean treatment duration was only 16.1 ± 3.5 (mean ± SD) hours per day, leading to a mean effluent flow rate (averaged over 24 h) of 1.4 ± 0.3 L/h. The mean prescribed and delivered CRRT doses were 24.5 ± 6.7 and 16.6 ± 5.4 mL/kg/h, respectively (p< 0.000001), equating to delivery of only 68% of the prescribed dose. Clotting of the extracorporeal circuit was the most common cause of downtime.
In the DO-RE-MI trial, approximately 80% of patients received only CRRT in the trial and significant variability in delivered dose was observed among patients and even within the same patient on different days [65]. (In the CRRT group, data from 81 patients having at least one treatment interruption of 18 h or more notably were not included in the analysis.) Intensive CRRT was defined by a prescribed dose ≥35 mL/kg/h, but only 22% of patients fell in this category. While the median prescribed dose was 34.3 mL/kg/h, the median delivered dose was approximately 20% less (27.1 mL/kg/h), with circuit clotting contributing to 74% of downtime incidents.
Claure-Del Granado et al. [28] performed a thorough analysis of prescribed vs. delivered CRRT dose in 52 patients treated with pre-dilution CVVHDF. Despite the use of citrate anticoagulation in all patients, filter clotting was the single leading cause of therapy downtime, although causes unrelated to the extracorporeal circuit were collectively more common. Delivered (urea-based) dose, estimated from standard CRRT clearance equations (accounting for pre-dilution), was only 73% of the prescribed effluent dose. Thus, treatment downtime and pre-dilution combined to produce a 27% decline in the urea clearance actually delivered on average, relative to the theoretical clearance based only on the prescribed effluent volume.
Modality Considerations
While a 1:1 relationship exists between the effluent rate and urea clearance when post-dilution CVVH is performed properly, this is not necessarily the case for other CRRT modalities [74]. For pre-dilution CVVH, Clark et al. [75] evaluated the interrelationship between blood flow rate and replacement fluid rate in the achievement of urea clearances equivalent to 35 mL/kg/h. For this modality, pre-dilution precludes the possibility of a 1:1 relationship between the effluent rate and urea clearance, and therapy prescription should aim to achieve the desired depuration with acceptable volumes of replacement fluid. At low blood flow rates (<150 mL/min), the relatively high replacement fluid rates required to provide effluent doses frequently desired in clinical practice (25 mL/kg/h or more) result in a substantial reduction of blood urea concentration due to pre-dilution. This dilution effect reduces urea clearance by the filter in a potential “vicious cycle,” which can be interrupted only by an increase in the blood flow rate. In most patients, a blood flow rate of at least 200 mL/min is needed for the efficient operation of pre-dilution CVVH. (Of note, the same is true for postdilution CVVH to avoid excessive hemoconcentration.) When traditional CRRT blood flow rates in the range of 125-150 mL/min are used, Troyanov et al. [76] have demonstrated the decrease in solute clearances for pre-dilution (relative to post-dilution) CVVH can be as high as 30-40%.
On the other hand, recent data suggest that a reasonably orderly relationship between the effluent rate and urea clearance is established in pre-dilution CVVH as long as an adequate blood flow rate is achieved. Using a blood flow rate of 200 mL/min, Huang et al. [74] measured the clearance of urea and larger molecular weight solutes as a function of ultrafiltration rate over a range of 20-60 mL/min, corresponding to 1.2-3.6 L/h. (In this laboratory study, isovolemic hemofiltration was performed so ultrafiltration rate and replacement fluid rate are synonymous.) As shown in Figure 3, an essentially direct relationship exists between clearance and the ultrafiltration rate for all solutes, with a slight inflection at a value of 40 mL/min for the latter. (Convective removal of vancomycin and inulin occurred at a lower rate due to their relatively higher molecular weights.) However, it is important to highlight that the urea relationship is not 1:1 and the degree of divergence between the 2 parameters increases progressively (at constant blood flow rate). Specifically, at ultrafiltration rates of 20, 40, and 60 mL/min, the ratio of urea clearance to ultrafiltration rate is approximately 90, 80, and 70% - accordingly, the degree of pre-dilution “penalty” progresses predictably (approximately 10, 20, and 30%, respectively).
![Fig. 3. Solute clearance as a function of ultrafiltration rate in isovolemic predilution hemofiltration. Urea clearance was measured at ultrafiltration rates of 1.2, 2.4, and 3.6 L/h. The blood flow rate was 200 mL/min. Reprinted with permission from the publisher [74].](https://karger.silverchair-cdn.com/karger/content_public/journal/bpu/44/2/10.1159_000475457/2/m_000475457_f03.jpeg?Expires=1716296434&Signature=Pfa8iU~rfxA62rj1vAIcKFqDaHXMmheYrSW18mP4o6St3EL8xqJ~WVI~GsfWjwu~GOpHMMMGQg6DFoOdfrKKs-VqOPodX3u9WRVCfU1nrz43hdyFYnyXQh2ynFcZIbNB1BwO48gDc4trl4UVE4zXZ7y-YG8H4BepUnuoFPBpeF5DYZBBRjWk9J2XS4DILsXYLCk0DZfLmw1BJs1FIxc8CYac~i~Yvs9dbfwr9rT1IylRqdeVScIJ5kZevySNojc7JTVd7Jm~SkACCa1BIBf8SJxOqLiC8gJrKhZXs8OodValhmsufrRJPlck~gk8WfmwbBkMp429RGTbMWxWyhxzkw__&Key-Pair-Id=APKAIE5G5CRDK6RD3PGA)
Solute clearance as a function of ultrafiltration rate in isovolemic predilution hemofiltration. Urea clearance was measured at ultrafiltration rates of 1.2, 2.4, and 3.6 L/h. The blood flow rate was 200 mL/min. Reprinted with permission from the publisher [74].
Solute clearance as a function of ultrafiltration rate in isovolemic predilution hemofiltration. Urea clearance was measured at ultrafiltration rates of 1.2, 2.4, and 3.6 L/h. The blood flow rate was 200 mL/min. Reprinted with permission from the publisher [74].
With consideration of other CRRT modalities, the prescription parameters most significantly influencing small solute clearance in CVVHD are filter surface area and dialysate flow rate [77,78]. For optimal functioning of CVVHD with respect to urea clearance, saturation of the effluent dialysate is necessary, implying equivalence between the incoming blood and effluent urea nitrogen concentrations. For effluent doses of 20 mL/kg/h and beyond, filters having membrane surface areas of at least 1.0 m2 are required to achieve this saturation. Finally, CVVHDF involves the consideration of all of the above factors, especially when prescribed in the pre-dilution mode [79].
Reconciling Effluent-Based and Clearance-Based Doses: The Standard Kt/V for CRRT
Effluent-based dosing is the foundation for prescription and delivery of CRRT due to the strength of the underlying evidence base. However, as emphasized in this review, substantial differences between the effluent dose and the actual solute clearance may exist under many CRRT operating conditions. Providing clinicians with an additional parameter that clarifies these differences is especially timely in light of the most recently held consensus conference of the Acute Dialysis Quality Initiative. The conference highlighted the need for adapting continuous therapies to conform to the era of personalized medicine, specifically calling for the application of “precision CRRT” in clinical practice [80]. In the opinion of the authors, supplementation of evidence-based effluent dosing with a CRRT-specific standard Kt/V is one step in this direction.
At the initiation of CRRT, a hypothetical patient of target weight 80 kg (W) can be used to define standard Kt/V in relation to effluent-based dosing. The following assumptions apply:
1. Urea volume of distribution at CRRT initiation = 0.65·W = 52 L (corresponding to 10% fluid accumulation at that point) [53]
2. Average V during the course of CRRT = 48 L (assuming 100% correction of fluid overload) [81,82]
3. 24-h operation of CRRT with delivered CRRT dose of 25 mL/kg/h.
Based on these values, standard (daily) Kt/V can be calculated, with the assumption that a 1:1 relationship between effluent volume and urea clearance exists over a 24-h period.
Kt/V = (25 mL/kg/h)·(80 kg)·(24 h)·(1 L/1,000 mL)/ 48 L = 1.0
As discussed previously, the major factors causing divergence between the effluent-based dose and this daily Kt/V parameter are fluid overload, impaired filter performance, treatment downtime during the course of a particular day, and pre-dilution. It is acknowledged that estimates for urea distribution volume in AKI have varied significantly in previous trials and the above Kt/V calculation, developed for a typical CRRT population, attempts to bracket the range that has been reported in the literature. Based on a study using stable isotopes to estimate distribution volume, Ikizler et al. [53] reported values substantially above those based on conventional TBW estimates. For purposes of dosing RRT, they recommended a 20% increase in V relative to these conventional estimates - the 65% initial estimate in the above standard Kt/V calculation is very much in line with this recommendation. In Figure 4, estimates are provided for the degree to which delivered Kt/V may be reduced for varying levels of treatment downtime (in hours per day; Fig. 4a) and fluid overload (Fig. 4b) [83].
![Fig. 4. Estimates for the decrement in delivered Kt/V due to treatment downtime and fluid overload during CRRT. The influences of downtime ranging from 0 to 6 h per day (a) and percent fluid overload values ranging from 0 to 20% (along with fluid deficit of 10%; b) are shown. Reprinted with permission from www.ADQI.org [83].](https://karger.silverchair-cdn.com/karger/content_public/journal/bpu/44/2/10.1159_000475457/2/m_000475457_f04.jpeg?Expires=1716296434&Signature=tyb9M2UtKSCC~udoPdJqadNFoi-p3i0oAI2ndTCF0O~6D4jnkE5IRlMuiyGdN4oBQ2hKplba7Gg42KBGHEA1ER4Ac1wZXzTDaGXXljXc6rRyWF6VEyJ65x0XNeciyDkOvIMe4EQumE~vcu3OBhaTIylgCy1C2hBx6Uo3QlW7lklNuGaUsa6Mxiwbral9WFdEKBC8bTweLOLoFNiLqdo6ZOAbC1MiSG2Bjeum1YvR2lBfNi~svThYUHa7hmXFjNR468Lu9Jr5xzIflmHeLBHTuWq0rfUMLkz3MbKAB4VTU8sdAnkzZMCKcYn0JnSapze3g7PIJgnYR27qpMUArdHyrA__&Key-Pair-Id=APKAIE5G5CRDK6RD3PGA)
Estimates for the decrement in delivered Kt/V due to treatment downtime and fluid overload during CRRT. The influences of downtime ranging from 0 to 6 h per day (a) and percent fluid overload values ranging from 0 to 20% (along with fluid deficit of 10%; b) are shown. Reprinted with permission from www.ADQI.org [83].
Estimates for the decrement in delivered Kt/V due to treatment downtime and fluid overload during CRRT. The influences of downtime ranging from 0 to 6 h per day (a) and percent fluid overload values ranging from 0 to 20% (along with fluid deficit of 10%; b) are shown. Reprinted with permission from www.ADQI.org [83].
The effects of pre-dilution and impaired filter performance on therapy delivery are difficult to quantify and are not explicitly included in the above standard Kt/V equation. Nevertheless, they are important considerations. As mentioned previously, a critical aspect of pre-dilution therapies is the relationship between the blood flow rate and replacement fluid rate. When relatively low blood flow rates (150 mL/min or less) are prescribed for therapies aiming to achieve delivered doses of 25 mL/kg/h or more, the pre-dilution “penalty” typically falls in the 15-20% range for CVVHDF and 30% or more for CVVH [62,68,75,76]. Likewise, clinicians should be vigilant for potential signs of impaired filter performance, leading to reduced solute clearance. Effluent urea nitrogen concentrations that are less than expected and increasing circuit pressures suggest this possibility.
Dosage adjustments made in response to the above considerations are consistent with the concept of “dynamic CRRT,” in which the treatment is adapted to the constantly changing clinical status of a critically ill AKI patient [83]. This concept also allows for the standard Kt/V target itself to be modified in a given patient, depending on the clinical course (e.g., a hypercatabolic, septic patient in need of higher dose to control azotemia).
Standard Kt/V was first proposed by Gotch to allow for comparisons of continuous and intermittent therapies in maintenance dialysis and incorporates 2 fundamental tenets [31]. First, despite having lower instantaneous clearance rates, continuous therapies in general provide more effective small solute removal than intermittent therapies (on a mL/min of clearance basis). Second, as discussed previously, Kt/V values from individual treatments in an intermittent schedule cannot be added simply for comparison with a therapy provided continuously during the same period. On the other hand, due to the continuous nature of CRRT, simple addition of daily Kt/V values can produce a representative weekly standard Kt/V. Of note, our calculation of a standard daily Kt/V of 1.0, corresponding to a delivered CRRT dose of 25 mL/kg/h, is precisely aligned with the original standard Kt/V description, which used another continuous therapy (PD) as the reference [31]. However, it is worthwhile to emphasize that the recommended target for delivered weekly Kt/V in AKI patients treated with PD is only 3.5 [84], demonstrating the substantial difference in small solute removal capabilities for this modality and CRRT.
The authors acknowledge that the clinical relevance of urea as a toxin per se is very much an open question, especially in light of large prospective studies performed in ESRD patients. Nevertheless, the fact remains that urea is the only surrogate molecule whose kinetics during renal replacement therapy are well understood by clinicians. Moreover, the use of other established markers to assess the clinical efficacy of CRRT, such as serum bicarbonate and pH for the evaluation of metabolic acidosis, is not based on definitive “proof” from prospective trials, but nevertheless occurs routinely in clinical practice. Based on these precedents, the authors strongly believe that standard Kt/V is a logical and useful supplementary tool for clinicians in their evaluation of CRRT efficacy.
Finally, while both effluent-based and solute clearance-based dosing are important factors influencing the overall adequacy of CRRT provided to a given patient, many other factors are important. Indeed, fluid management, electrolyte/acid-base control, nutrition, and drug dosing are but a few of the other challenges that require thoughtful consideration by the clinical team [85]. Only by addressing the entire spectrum of the patient's clinical needs can sustained outcome improvements be achieved for this population.
Pediatric Considerations
No published recommendations for RRT dose prescription in children currently exist and only observational data appear in the literature [86]. In a recent systematic review including studies published after the year 2000 and excluding patients treated for inborn errors of metabolism, pediatric dose prescriptions ranging from less than 1,000 to more than 4,000 mL/h/1.73 m2 and from 20 to 150 mL/kg/h have been reported [87].
One of the most controversial aspects of pediatric CRRT dosing relates to the effect of changing body composition from birth to adult age on TBW. As a child grows, TBW progressively decreases from approximately 80% of neonatal body weight to the adult percentage of about approximately 50-60% [87]. Hence, infants and neonates might require a relatively higher dialytic dose in comparison to adult patients and dosing of a continuous therapy in a pediatric patient should be inversely proportional to age, weight, and body surface area (BSA). For example, the administration of a 35 mL/kg/h dose to a 3 kg neonate with a BSA of 0.2 m2 for 24 h corresponds approximately to 0.9 L/h/1.73 m2[87]. Of note, weight and BSA are not linearly related, as weight physiologically increases from neonatal to adult age by an approximate factor of 20-25 and BSA by only an approximate factor of 10. As such, when dose prescription is indexed to BSA, treatment intensity for neonates and infants is 1.5-3 times greater than that of an adult patient. Consequently, the most commonly proposed pediatric dose of 2 L/h/1.73 m2[88] corresponds approximately to 80 mL/kg/h for a newborn patient but to 35 mL/kg/h for a 16 year old young man of weight 70 kg and BSA 2 m2.
On the other hand, the implementation of daily Kt/V might help to standardize pediatric CRRT prescription in a manner consistent with that of the adult patient. From an operational perspective, the daily Kt/V of 1 resulting from a dose of 35 mL/kg/h in a 3 kg neonate with a TBW of 2.4 L is the same as a dose of 25 mL/kg/h in a 70 kg adult with a TBW of 42 L. As discussed above for adult patients, it is particularly important to consider the effect of fluid overload on effective urea distribution volume. Although Ricci et al. [89] have recently taken the first step to validate this concept in a small cohort of neonates, further studies are clearly required.
Summary
A comprehensive review of RRT quantification in AKI has been presented with a focus on urea kinetics. Previous work in applying UKM both to ESRD and AKI patients has provided a good foundation for the development of a unified parameter, the standard Kt/V, to be used in conjunction with effluent-based dosing in CRRT. This parameter is certainly not designed to supplant effluent-based dosing but, instead, to complement it. Future advances in clinical practice and technology, such as incorporation of effluent urea nitrogen measurements either through clinical protocols [32] or CRRT machines equipped with online sensors [90], can improve upon this approach. In the meantime, it is hoped that this new parameter can solidify clinicians' understanding of CRRT dosing and improve the care of critically ill AKI patients treated with this modality.
Disclosure Statement
W.R.C. was formerly employed by Baxter Healthcare, has received consulting fees from Baxter, and owns Baxter stock. W.R.C. is also a consultant for Nikkiso America and Medtronic.
