

Abstract
Introduction: Primary liver cancer is a significant cause of cancer-related death in both the United States and the world at large. Hepatocellular carcinoma comprises 90% of these primary liver cancers and has numerous known etiologies. Evaluation of these identified etiologies and other traditional risk factors cannot explain the high incidence rates of hepatocellular carcinoma in Texas. Texas is home to the second largest petrochemical industry and agricultural industry in the nation; industrial activity and exposure to pathogenic chemicals have never been assessed as potential links to the state's increased incidence rate of hepatocellular carcinoma. Methods: The association between the county-level concentrations of 4 air pollutants known to be linked to liver cancer, vinyl chloride, arsenic, benzene, and 1,3-butadiene, and hepatocellular carcinoma rates was evaluated using nonparametric generalized additive logistic regression and gamma regression models. Hepatocellular carcinoma incidence rates for 2000-2013 were evaluated in comparison to 1996 and 1999 pollution concentrations and hepatocellular carcinoma rates for the subset of 2006-2013 were evaluated in comparison to 2002 and 2005 pollution concentrations, respectively. Results: The analysis indicates that the relationship between the incidence of liver cancer and air pollution and risk factors is nonlinear. There is a consistent significant positive association between the incidence of liver cancer and hepatitis C prevalence rates (gamma all years, p < 0.05) and vinyl chloride concentrations (logistic 2002 and 2005, p < 0.0001; gamma 2002 and 2005, p < 0.05). Conclusions: This study suggests that vinyl chloride is a significant contributor to the incidence of liver cancer in Texas. The relationship is notably nonlinear. Further, the study supports the association between incidence of liver cancer and prevalence of hepatitis B.
Introduction
Primary liver cancer is the third leading cause of cancer-related deaths in the world and seventh in the United States [1]. Of the types of primary liver cancers, approximately 90% in the United States (US) are hepatocellular carcinoma (HCC) with the other 10% being intrahepatic cholangiocarcinoma [2]. The known etiologies of HCC are comprised of hepatitis C (HCV) and B (HBV) virus infection, nonspecific cirrhosis, and alcohol-induced liver disease. In addition, obesity and diabetes mellitus type 2, which are highly correlated, have been shown to increase the risk of HCC [3].
HCC and its mortality rates are unequally distributed geographically in the US. In a recent study, the national incidence rate of HCC per 100,000 persons age-adjusted to the 2000 US population was reported at 5.4 (95% CI 4.3-6.6) with a mortality rate of 2.1 (95% CI 1.9-2.3) [4]. Comparatively, Texas ranks third in the US with an incidence rate significantly higher than and almost double the national rate, 9.9 (95% CI 9.7-10.1), and a mortality rate over 3 times the national rate, 7.5 (95% CI 7.4-7.7) [5].
In developed countries, HCV chronic infections have been shown to increase the risk of HCC 20- to 30-fold, though an increased incidence of HCV is not present in Texas [2,6,7,8]. Yalamanchili et al. [9] described the prevalence of HCV infection in Texas (1.79% of the population) to be similar to the national rate (1.8%). These statistics suggest that HCV incidence rates are not the most influential cause for the increase of HCC risk in Texas.
Other known risk factors for HCC, such as use of alcohol and tobacco and obesity, also do not appear to explain the higher incidence of HCC observed in Texas. According to the latest statistics of alcohol consumption per capita in the US from the National Institute on Alcohol Abuse and Alcoholism, the total national amount of alcohol consumption was 2.26 gallons per capita, while in Texas consumption was reported to be lower, 2.00-2.24 gallons per capita [10,11,12]. In 2011 in Texas, the prevalence of adults smoking cigarettes was 19.2%, the 14th highest in the nation, with this rate ranging from 11.8 to 29.0% across all states [13,14,15]. The latest statistics from the Centers for Disease Control and Prevention (CDC), regarding the distribution of obesity in the US, places Texas in the 16th place nationwide with a prevalence of 30.9% (95% CI 29.5-32.3), while the national prevalence is 34.9% [16,17].
What has not been explored as a possible explanation of the increased rates seen in Texas is exposure to selected chemical pollutants which have been linked with liver pathogenesis. The liver is the most common site of tumor origin in experimental animals exposed to carcinogenic chemicals [18]. Moreover, some epidemiological studies on cancer incidence and mortality have shown that individuals in occupations that involve exposure to chemicals are at a higher risk of developing primary liver cancer [19]. Specifically, according to the latest evaluation reports of the International Agency for Research on Cancer (IARC), the chemicals vinyl chloride and arsenic (inorganic) have been found to have a carcinogenic effect on the human liver. Wong et al. [20] analyzed mortality in PVC workers and found an increased standardized mortality ratio for malignant liver neoplasms (1.78, 95% CI 1.15-2.62). Associations have also been found between chronic arsenic exposure and cancers of the skin, bladder, lung, and liver in other studies [21,22]. In addition, the chemical 1,3-butadiene and benzene have been found to cause tumors in laboratory animals in multiple species in multiple sites including the liver [23]. In the case of 1,3-butadiene, the cancers are hemangiosarcoma of the liver as well as heart and lymphomas, and lung cancers [23], and in the case of benzene, the cancers are liver as well as hematopoietic, oral and nasal, forestomach, preputial gland, lung, ovary, and mammary gland [24,25].
One mechanism of exposure to these chemicals could occur through ambient air. Hazardous pollutants in the air occur largely from emissions from industrial sources and exhaust from motor vehicles [26]. The US Environmental Protection Agency (EPA) recognized hazardous air pollutants as a concern for human health in 1990 [27] and tracks their concentration by census tract across the US periodically through the National Air Toxics Assessment (NATA). While the association between cancer and air pollution is difficult to assess using epidemiology because of the many confounding factors, the multiple studies conducted by others highlight the recognition that, although difficult, the problem is an important one to consider [28,29,30,31].
Because the high rate of HCC observed in Texas is not explained by other risk factors, and given that Texas has the second largest petrochemical industry and agricultural industry in the nation, we hypothesize that chronic exposure to selected air toxics may contribute to the increased risk.
Texas has a high density of emissions in some counties and a low density in others, resulting in varying levels of hazardous air pollutant concentrations by county. We believe the variation provides a good basis to conduct an ecologic investigation of the association between the rate of HCC with HCV and known carcinogenic pollutants such as vinyl chloride, arsenic, benzene, and 1,3-butadiene. This study links data from 2 large databases, the Texas Cancer Registry and the National Air Toxic Assessment, to assess the association of these hazardous air pollutants and HCC. The selected chemicals, which have been previously linked to liver cancer, were also found to be of definite unacceptable risk (benzene and 1,3-butadiene) or probable risk (vinyl chloride and arsenic) to cause significant health risks for current and future residents in a study focused on Houston [32]. This research provides an important first step in understanding the role of toxic air pollutants and increased HCC rates in Texas.
Methods
This ecological study examines the association between HCC county-level incidence rates in Texas and known hepatic carcinogen concentrations of vinyl chloride, arsenic, benzene, and 1,3-butadiene found in air. Two statistical methods were employed to examine the association. The HCV prevalence and the number of prisons in each county were also included in the analysis to control for confounding from these variables. This study used only data from public databases. No animals or human subjects were utilized in the study and therefore no institutional approval (IRB or AICUC protocols) were obtained.
Data
The analysis was conducted using data obtained from publicly available sources of HCC incidence, air pollutant concentrations for vinyl chloride, arsenic, benzene, and 1,3-butadiene, HCV prevalence, obesity prevalence, and the number of prisons in a county.
Individual county incidence rates of liver cancer were obtained from the Texas Cancer Registry of the Texas Department of State Health Services, the 4th largest cancer registry in the US. This registry receives approximately 240,000 reports of cancer annually from over 500 hospitals, cancer treatment centers, ambulatory surgery centers, and pathology laboratories located throughout the state. Rates are age-adjusted to the 2000 US standard population and reported per 100,000 people. The Texas Cancer Registry suppresses rates in the database if fewer than 16 cases were reported in the specified county, as these are too few to calculate a stable age-adjusted rate. The study focused on HCC county-level incidence rates recorded in the Texas Cancer Registry for the period of 2000-2013 and the subset 2006-2013. For the 2000-2013 period, of the 254 counties in Texas, HCC incidence rates were reported for 146 counties and suppressed for 108 counties due to low counts. In the subset from 2006 to 2013, of the 254 counties in Texas, HCC incidence rates were reported for 117 counties and suppressed for 137 counties due to low counts.
The count of liver cancer cases occurring in Texas by gender, race, and ethnicity during the 2 time frames evaluated are shown in online supplementary Table 1 (for all online suppl. material, see www.karger.com/doi/10.1159/000475776). The majority of cases occur in men, 73 and 74%, for the 2000-2013 and 2006-2013 periods, respectively. The predominant race of cases was white, 44% for both year ranges.
Statistics of the liver cancer rates between counties for the time periods 2000-2013 and 2006-2013 are shown in online supplementary Table 2. The mean and interquartile range (first and third quartile) of the age-adjusted liver cancer rates per 100,000 persons across counties were 7.82, 6.10, and 9.00, respectively, for the 2000-2013 period and 8.28, 6.50, and 10.10, respectively, for the 2006-2013 period.
The HCV prevalence rate was obtained from the National Health and Nutrition Evaluation Survey [33]. Because a high percentage of people (27-48%) in the prison system have HCV infection in Texas, prisoners represent a population at significantly higher risk of developing HCC [34]. To control for this relationship, the number of prisons in each county was included in the statistical model [35]. The population within each prison over the study period was not available. Of the 254 counties, 22.05% contain between 1 and 7 prisons. The county-level estimates of obesity of adults in Texas in 2009 were obtained from CDC (www.cdc.gov).
The pollutants evaluated in the study were vinyl chloride, arsenic, benzene, and 1,3-butadiene. As previously discussed, these pollutants were selected because of their link to liver cancer. HCC rates for 2000-2013 were evaluated in comparison to 1996 and 1999 pollution concentrations and HCC rates for the subset of 2006-2013 were evaluated in comparison to 2002 and 2005 pollution concentrations, respectively. The timeframe of cancer incidence rates intentionally lags the air pollution data to account for a latency period for HCC.
The concentrations were obtained from the EPA NATA [36]. The EPA developed the NATA as a screening tool that state, local, and tribal agencies may use to prioritize pollutants, identify areas of concern, and develop a better understanding of pollutant concentrations [37]. The EPA continually improves the methodology used and releases a new assessment every 3-4 years. NATA uses data from the national emissions inventory of air toxics constructed from measurements of stationary source emissions, on-road and non-road mobile emissions, and estimates of background emissions and secondary formed emissions to estimate concentrations at the census tract and county level [36].
The EPA advises not to compare concentrations across NATA years because differences between years may reflect a combination of changes in concentration levels as well as refinement and improvements in the assessment methodology. In this analysis, 4 NATA concentration periods are used to examine the consistency between county associations. However, more recent NATA data are expected to be more accurate due to the methodological improvements.
The distribution of concentrations of the selected pollutants estimated from NATA in each county for the years 1996, 1999, 2002, and 2005 are provided in online supplementary Figure 1. The distribution of concentrations by county is highly right skewed.
The counties in Texas with rates of HCC in the fourth quartile are shown in blue in Figure 1 (for colors, see the online version). Similarly, the counties with concentrations in the fourth quartile of arsenic, 1,3-butadiene, vinyl chloride, and benzene are colored brown, yellow, purple, and green, respectively. The top left map shows the air pollution from 1996 and the HCC rate from 2000-2013, where 4.7% of counties simultaneously exhibited the fourth-quartile HCC rates and all 4 pollutants. The top right map shows the air pollution from 1999 and the HCC rate from 2000-2013 with 3.5% of counties with simultaneous fourth-quartile HCC rates and all 4 pollutants. The lower left and lower right maps show air pollution from 2002 and 2005, respectively, and the HCC rate from 2006 to 2013, each with 4.3% of counties with simultaneous fourth-quartile HCC rates and all 4 pollutants.
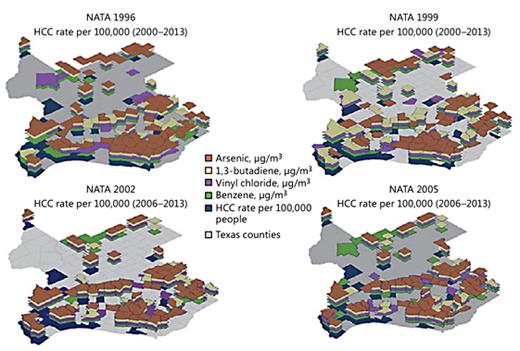
Counties in the upper quartile of HCC incidence rate per 100,000 people (2000-2016 and 2006-2016), or air pollution levels (NATA 1996, 1999, 2002, and 2005) for vinyl chloride, arsenic, 1,3-butadiene, or benzene.
Counties in the upper quartile of HCC incidence rate per 100,000 people (2000-2016 and 2006-2016), or air pollution levels (NATA 1996, 1999, 2002, and 2005) for vinyl chloride, arsenic, 1,3-butadiene, or benzene.
Spearman's rank correlation coefficients were used to assess correlation between pollutants within each of the 4 NATA years. The strongest correlations consistently occurred between benzene and 1,3-butadiene with ρ ranging from 0.8 to 0.67.
Statistical Analysis
The association between the HCC incidence rate variation by county and the air pollution levels were analyzed using 2 methods: logistic regression and gamma regression. Because 4 sets of county air pollution data were used (1996, 1999, 2002, and 2005), there are 8 sets of results: a logistic regression model for air pollution data from each pollution year and a gamma regression model for air pollution data from each pollution year. Data were transformed and standardized prior to statistical analysis using the optimal Box-Cox transformation. The regression was conducted in a stepwise manner for combinations of the pollutants. Also included was an interaction term of the product of benzene and 1,3-butadiene concentrations because they were found to be correlated.
Logistic Regression
The first analysis examined the relationship between a positive HCC rate (i.e., the presence of a rate; zero and low rates were suppressed) for each of the 254 counties in the state according to the risk factors. A nonparametric generalized additive model was used to capture the nonlinear relationships present [38]. The risk factors considered were the prevalence rate of HCV and air pollution levels for vinyl chloride, arsenic, benzene, and 1,3-butadiene, and the number of prisons. The model provides a probability of a positive HCC rate given the rate of HCV and these pollutants.
Gamma Regression for Counties with Reported HCC Rates
Of the counties in Texas, the HCC rates were suppressed in 108 counties for the 2000-2013 period and in 137 counties for the 2006-2013 subset. Therefore, the second analysis examined the 146 and 117 counties where a HCC rate was reported for the respective time period. The relationship between the HCC rate and the same risk factors discussed above were considered through a nonparametric generalized additive gamma regression model. Again, the nonparametric model was used to capture the nonlinear relationship between the risk factors and the transformed HCC rate. Analyses were performed using R with packages ggplot2 [39] and mgcv [40].
Results
Logistic Regression
The p values from the final logistic regression model assessing the relationship between the presence of a positive HCC rate and the risk factors in a county are listed in Table 1. The table lists p values for 4 cases of the logistic regression model indicating if there was a statistically significant association between the pollution and the HCC rate: (1) pollution from 1996 matched with HCC rates from 2000 to 2013, (2) pollution from 1996 matched with HCC rates from 2000 to 2013, (3) pollution from 2002 matched with HCC rates from 2006 to 2013, and (4) pollution from 2005 matched with HCC rates from 2006 to 2013.

No statistically significant association was found between the presence of a positive rate of HCC within a county and the prevalence of HCV in a county regardless of air pollution assessment year. HCV was retained in the final model because it is a known risk factor. The variable indicating the number of prisons was significant in 3 of 4 of the pollution years evaluated, so it was retained in the final model. Obesity was analyzed as a confounder, but no significant association was found. The interaction term of benzene and 1,3-butadiene was not significant and dropped from the final model.
Vinyl chloride was positively and significantly associated with the presence of a positive HCC rate for concentrations reported by NATA in both 2002 and 2005. No association was found for NATA in 1996 or 1999.
Arsenic was positively and significantly associated with the presence of a positive HCC rate for concentrations reported by NATA in 2005 but not in other years.
The association between benzene and the presence of a positive HCC rate was positively and significantly associated for concentrations reported by NATA in 1996, significant but nonlinear for concentrations reported by NATA in 1999, not significant for concentrations reported by NATA in 2002, and negatively and significantly associated for concentrations reported by NATA in 2005.
1,3-butadiene was positively and significantly associated with the presence of a positive HCC rate for concentrations reported by NATA in 1996, 1999, and 2002 but not in 2005.
Online supplementary Figure 4a and b depicts the relationship between each evaluated air pollutant and the probability of a positive HCC rate in a county for pollutant assessment years 2002 and 2005, respectively. Online supplementary Figure 2a and b shows the relationship in 1996 and 1999.
Gamma Regression for Counties with Reported HCC Rates
The p values from the gamma regression model assessing the relationship between the HCC rate and the risk factors in a county are listed in Table 1. The variable controlling for the number of prisons in the county was not statistically significant regardless of which air pollution assessment year is used and therefore dropped from further analyses (p values ranged from 0.165 to 0.914). The interaction term of benzene and 1,3-butadiene was also not significant and dropped from the final model.
HCV was positively and significantly associated with the HCC rate for concentrations reported by NATA in all years. Obesity was significantly associated with the HCC rate for concentrations reported by NATA in all years.
Vinyl chloride was positively and significantly associated with the HCC rate for concentrations reported by NATA in both 2002 and 2005. The association was not significant in 1996 while there was significant but nonlinear association in 1999.
Arsenic was significantly associated with the HCC rate for concentrations reported by NATA in both 2002 and 2005. The associations were not significant for concentrations reported by NATA in 1996 and 1999.
1,3-butadiene was negatively and significantly associated with the HCC rate for concentrations reported by NATA in 1996, 1999, and 2005 but not in 2002.
Figure 2a and b depicts the relationship between each evaluated air pollutant and the probability of a positive HCC rate in a county for pollutant assessment years 2002 and 2005, respectively. Sensitivity and cross-validation studies were conducted to ensure a robust choice of variables. The uncertainty associated with the nonlinear effect of each predictor variable is depicted in Figure 2. In addition, the independent observations are highlighted in Figure 2 on the respective x axes. Online supplementary Figure 3a and b shows the relationship in 1996 and 1999.

Gamma regression plots of HCC rates (2006-2013) for the transformation of HCV prevalence rates, obesity prevalence rates, and air pollutants (arsenic, benzene, vinyl chloride, and 1,3-butadiene): data from NATA 2002 (a) and data from NATA 2005 (b).
Gamma regression plots of HCC rates (2006-2013) for the transformation of HCV prevalence rates, obesity prevalence rates, and air pollutants (arsenic, benzene, vinyl chloride, and 1,3-butadiene): data from NATA 2002 (a) and data from NATA 2005 (b).
Discussion
The statistical analysis confirms that the relationship between county scale HCC incidence rates and environmental pollution or risk factors is largely nonlinear and therefore best modeled with flexible processes.
Two statistical models were used, one testing the association of the presence of a positive HCC incidence rate and risk factors (logistic regression) and the other testing the association of the magnitude of the HCC incidence rate and risk factors (gamma regression). The conclusions drawn from the logistic regression model are naturally more limited because the association is measured in terms of presence or absence of a positive HCC incidence rate and not the magnitude of the rate. Some counties do not have HCC incidence rates - either the rate is zero or too low to be stable. The logistic regression allows all counties to be included in the analysis. Ideally, the use of 2 models provides more insight into the associations explored by reinforcement of the finding. However, the 2 statistical methods used to assess the nonlinear relationship between HCC and environmental pollution or risk factors over the four sets of pollution assessment years do not provide entirely consistent results for any one independent variable.
In these models, the HCV risk factor, increased risk of HCC in populations with HCV, was included in 2 ways: county-level HCV prevalence rate and number of prisons in the county. The presence of a positive HCC incidence rate was found to be positively and significantly associated with the number of prisons in a county in 3 of the 4 sets of pollution years evaluated according to the logistic regression analysis, but un-impactful in the gamma regression analysis and dropped from the model.
Perhaps controlling for the known increase in HCV in prison populations using the blunt variable of number of prisons in a county was sufficient to impact the association defined by the logistic regression, but more granularity would be needed to contribute to understanding the association in terms of magnitude of rate. As mentioned previously, more detailed information on the prisons, such as population, is not available. This is a limitation in the gamma regression analysis. However, the positive and significant association found in the logistic regression indicates that a variable representing prisons and/or prison populations should be considered in such an analysis.
Alternatively, HCC incidence rates were consistently positively and significantly associated with the HCV prevalence rates in the gamma regression analysis, but un-impactful in the logistic regression analysis. The gamma regression analysis reinforces the known association between HCC incidence rates and HCV prevalence rates.
Similarly, HCC incidence rates were not found to be impactful in the logistic regression analysis. There is a statistical association in the gamma regression; however, the association is unclear.
The clearest indication of an association between HCC rates and the air pollutants assessed may be in relation to vinyl chloride. Of the 4 sets of vinyl chloride pollution analyzed, in both 2002 and 2005 an increase in the presence of a positive HCC rate (logistic regression) and the magnitude of the HCC rate (gamma regression) was positively and significantly associated with an increase of vinyl chloride. This association was not found in 1996 and significant but nonlinear in the 1999 data. The more recent data, 2002 and 2005, where the association was found likely more accurately reflect the concentration as the NATA process was refined and improved over time.
Vinyl chloride, along with the other 3 air pollutants evaluated here, is regulated by EPA under the Clean Air Act but has no ambient air standard [41]. The state also has no standard but provides long-term levels that may be used as a reference for screening. In terms of vinyl chloride, the screening level is 1.2 μg/m3, while the highest average concentration in the years evaluated was well below this level at 0.0106 μg/m3[42]. If future research confirms an association between increased risk of HCC and vinyl chloride exposure, the screening level may not be protective.
There is also an indication of a relatively consistent association between HCC rates and 1,3 butadiene, although, interestingly, the association is negative in the gamma regression and positive in the logistic regression. The results of the association with respect to arsenic and benzene are inconsistent.
While not confirmatory, our study indicates a need for further investigation. Future research should take into account additional information on prison populations and possibly address the association at a finer granularity such as census tract. This would allow for further examination by demographic characteristics. In addition, a census tract level analysis of a city with a robust air pollution monitoring network of pollutants, whose data are not reflected in NATA, for example Houston, Texas, would provide additional insight into the relationship between HCC and air pollutants. HBV prevalence data are currently not available and should be included in future research if possible.
Acknowledgments
The authors thank Weijian Yu and John Pederson from Rice University for their work on this study.
Disclosure Statement
The authors declare no conflicts of interest.
