

Abstract
Next-generation sequencing technologies have led to a decreased cost and an increased throughput in genome sequencing. Yet, many genome assemblies based on short sequencing reads have been assembled only to the scaffold level due to the lack of sufficient chromosome mapping information. Traditional ways of mapping scaffolds to chromosomes require a large amount of laboratory work and time to generate genetic and/or physical maps. To address this problem, we conducted a rapid technique which uses laser capture microdissection and enables mapping scaffolds of de novo genome assemblies directly to chromosomes in Hawaiian picture-winged Drosophila. We isolated and sequenced intact chromosome arms from larvae of D. differens. By mapping the reads of each chromosome to the recently assembled scaffolds from 3 Hawaiian picture-winged Drosophila species, at least 67% of the scaffolds were successfully assigned to chromosome arms. Even though the scaffolds are not ordered within a chromosome, the fast-generated chromosome information allows for chromosome-related analyses after genome assembling. We utilize this new information to test the faster-X evolution effect for the first time in these Hawaiian picture-winged Drosophila species.
Along with the rapid development of massively parallel sequencing, or next-generation sequencing (NGS), DNA sequencing capabilities grow exponentially. This allows researchers to perform de novo genome assemblies for thousands of species, from viruses and insects to mammals (e.g., Genome 10K, i5K [Genome 10K Community of Scientists, 2009; i5K Consortium, 2013]). However, the complexity of the assembly task using short reads still poses a major challenge. Genome assemblies are hierarchical, and a typical de novo assembly process, especially for large eukaryotic genomes, often ends at the level of scaffolds, assembled from shorter assembly components called contigs (Ensembl database, http://www.ensembl.org/). With sufficient mapping information, scaffolds can be assembled into chromosomes. The mapping information may include genetic, physical, or optical maps [Dean et al., 2005; Chamala et al., 2013; Dong et al., 2013], as well as sequence data from long insert size or mate pair reads. All of these are highly laborious tasks even before the genomic location can be obtained.
An alternative approach for mapping scaffolds to chromosomes can be synteny-based, where a closely related species with assembled chromosome information is used as reference for mapping [Drososphila 12 Genomes Consortium, 2007; Stark et al., 2007; Schaeffer et al., 2008; Kim et al., 2013], or synteny across species inferred from a comparative analysis is utilized to order the scaffolds [Husemann and Stoye, 2010; Aganezov et al., 2015]. However, chromosome synteny alone should be treated with caution since structural and chromosomal rearrangements may have occurred even between closely related species. Assembly errors from the reference species assembly may also be transferred to the new species assembly [Ekblom and Wolf, 2014], thus affecting the accuracy of the mapping. For example, Drosophila melanogaster and D. simulans have diverged from each other for 2-8 million years [Obbard et al., 2012], but they have highly collinear genomes, with the exception of a large fixed inversion in chromosome arm 3R [Sturtevant and Plunkett, 1926] and a few minor inversions in the other chromosomes [reviewed in Aulard et al., 2004].Yet, unlike D. melanogaster, D. simulanshas very few segregating inversions, which provides certain advantages for the analysis of natural variation and experimental studies [Aulard et al., 2004; Schlötterer et al., 2015].
Alternatively, relatively quick chromosome mapping information can be obtained through the isolation of euchromatic segments from distinct chromosome arms using laser capture microdissection (LCM), coupled with whole-genome amplification and NGS [George et al., 2014]. Here, we test this approach in application to polytene chromosomes of Hawaiian picture-winged Drosophila species, an iconic example of sequential colonization, speciation, and adaptive radiation [Carson and Clague, 1995; Carson, 1997]. The Hawaiian picture-winged Drosophila played an important role as a model system in substantiating the modern evolutionary synthesis and the biological species concept [Mayr, 1963, 1982] and the formulation of the founder-event model for speciation [Carson and Templeton, 1984]. The Hawaiian Drosophila are estimated to have colonized the Hawaiian Islands approximately 25 mya and radiated into up to 800 extant species with approximately 120 of these belonging to the large picture-wing group [O'Grady et al., 2011]. Speciation in the Hawaiian picture-winged Drosophila involved allopatric speciation following the “progression rule” that occurred when a new species was founded on each new island as it emerged from the volcanic hotspot in the middle of the Pacific plate [Carson and Clague, 1995]. Sympatric species divergence within islands also appears to have occurred, in part due to switching host-plant associations [Magnacca and Price, 2015]. More recently, many of the Hawaiian picture-wing Drosophila have declined in numbers with 11 species now classified as endangered, including D. differensand D. heteroneura. However, to date genome information for the Hawaiian Drosophila is limited. Only 1 species of Hawaiian picture-wing Drosophila, D. grimshawi, was sequenced by the Drosophila 12 Genomes Consortium [2007], but this genome remains unfinished, and the scaffolding was partly guided by synteny with distantly related species. We have recently sequenced, pre-assembled, and analyzed genomes of 3 other Hawaiian picture-winged Drosophila species [Kang et al., 2016]. Chromosomal variation in Hawaiian picture-winged Drosophilawas of great taxonomical and biogeographical value, as the polytene karyotypes had been arranged into lineages reflecting a series of inversions within chromosome arms and species divergence [Carson, 1983]. Apart from the inversions, all these species possess 6 pairs (2n = 12) of highly syntenic chromosomes.
Based on LCM and NGS from polytene chromosomes, we assigned scaffolds to chromosomes from the following 3 closely related species with pre-assembled genomes: D. silvestris, D. heteroneura, and D. planitibia[Kang et al., 2016]. Although these scaffolds are still not localized or ordered within a chromosome, the initial chromosome information can be useful for further mapping, as well as for certain population and evolutionary analyses. For the latter, we exemplify the utility of LCM-based mapping in application to a preliminary test for faster-X chromosome evolution [Charlesworth et al., 1987] among the Hawaiian picture-winged Drosophila.
Materials and Methods
Flies and Genome Assemblies
D. differensis endemic to the island of Molokai, and the individuals used in this study are from the stock # Z27921 that was obtained from the Hawaiian Drosophila stock center at the University of Hawaii at Manoa (courtesy of K. Kaneshiro). The genome assemblies of D. silvestris, D. heteroneura, and D. planitibiawere obtained as described elsewhere [Kang et al., 2016]. Genes and repeats in the genome sequence were initially annotated as described previously [Kang et al., 2016] (see also below).
Polytene Chromosome Preparation, LCM, and Sequencing
Intact chromosome arms were isolated from larvae of D. differens using a published LCM protocol for isolating and amplifying the euchromatic segments of individual polytene chromosome arms [George et al., 2014]. One pair of salivary glands was placed in 1 drop of Carnoy solution on a Zeiss 1.0 PET membrane slide. Salivary glands were split into approximately 2-4 sections with dissecting needles and placed into a drop of 50% propionic acid on clean slides under a dissection microscope. A drop of 50% propionic acid was added to the glands for 3-5 min at room temperature. A siliconized coverslip was placed on top of the droplet. The slide was covered with an absorbent material (filter paper was used for this method), and while using the eraser side of a pencil, a generous amount of pressure was applied to the coverslip by tapping on it repeatedly with the eraser. The slides were heated to 60°C on a slide denaturation/hybridization system for 15-20 min to aid in flattening the polytene chromosomes. The slides were put into a humid chamber at 4°C overnight to allow the acid to further flatten the chromosomes. Then, they were placed in cold 50% ethanol for 10 min and the coverslips were gently removed. Slides were dehydrated in 50, 70, 90, and 100% ethanol for 5 min each and air dried. A solution of GURR buffer was prepared by adding a single buffer tablet to 1 L of distilled water and autoclaving. The Giemsa solution was prepared by adding 1 mL of Giemsa staining solution to 50 mL of GURR buffer. Air-dried slides were placed in Giemsa solution for 10 min and washed 3 times in 1× PBS. Slides were dried again in a controlled sterile climate to avoid contamination. LCM of chromosomes was done with the PALM MicroBeam Laser Microdissection system and the PALMRobo software as described previously [George et al., 2014]. Microdissected chromosomes were lysed to release gDNA. Whole-genome amplification was used to amplify the DNA from the microdissected material and to create libraries with the PicoPLEX™ DNA-seq kit (Rubicon Genomics, Ann Arbor, MI, USA). The 250-bp single-end libraries were further amplified exponentially with primers containing unique Illumina dual barcodes suitable for Illumina Miseq. A total of 24 single-chromosome samples were generated (Fig. 1). Each sample was assigned a putative chromosome ID according to its karyotype/chromosome banding pattern [Carson, 1983].

A-C Examples of microscopic images of LCM Drosophila differens chromosomes.
Quality Control and Mapping
Raw reads from sequencing were quality-controlled and filtered through FastqMcf [Aronesty, 2013]. Briefly, adaptors were clipped, and reads with average quality <30 or with more than 5 N (bad) bases were discarded. To reduce the possible contamination, reads were mapped to the bacteria database downloaded from NCBI (http://www.ncbi.nlm.nih.gov/), and unmapped reads were kept. To assess the quality of the samples, the clean reads were next mapped to D. planitibia[Kang et al., 2016], the D. grimshawi genome reference (http://flybase.org/), and the human genome reference (hg19; http://genome.ucsc.edu/) using BWA [Li and Durbin, 2009] with default parameters (Table 1). Samples with reads mapping against the human reference at a rate >60% or mapping against the D. planitibia reference at a rate <40% were removed (7 samples). The thresholds were found through trial and error to optimize the number of samples used. To obtain more valid chromosome information, reads from the remaining 17 samples were then mapped to repeat-masked D. melanogaster reference (dm3). The sizes of regions with at least 5 reads mapped were counted for each D. melanogasterchromosome. For each sample, the ratio between the highest count and the second highest count was calculated. Samples with this ratio <10 were considered possible chromosome cross-contaminations and were thus discarded (5 samples; Table 2). The remaining 12 samples were then merged into 5 groups with samples sharing the same best chromosome hit against D. melanogaster, and synteny with Muller element arm (for D. melanogaster, chrX, chr2L, chr2R, chr3L, chr3R, and chr4 correspond to Muller elements A, B, C, D, E, and F, respectively).
Quality control for mapping reads against Hawaiian Drosophila species and human genome references

Counts of mapping for each sample against masked D.melanogaster genome reference
Scaffold Chromosome Annotation
Reads of samples within the same group were combined to maximize data utilization. Grouped reads were mapped to draft assemblies from 3 Drosophilaspecies (D. silvestris, D. heteroneura, D. planitibia) using BWA with default parameters, while the draft assemblies were repeat-masked before mapping by RepeatMasker (Open-4.0, http://www.repeatmasker.org). For each scaffold in an assembly, mapping information for all 5 groups was collected, and the lengths of regions covered by at least 5 reads from each group were counted. Scaffold was assigned with chromosome/group information if the largest length was >1,000 and the second largest length was less than one tenth of the largest one (e.g., scaffold10 has a 10,000-bp region with each base covered by at least 5 reads from group MullerA, and it also has a 500-bp region covered by at least 5 reads from group MullerB; thus, we assigned MullerA to scaffold10). The remaining scaffolds were labeled as unassigned. In general, more than 65% of the total size of scaffolds could be assigned with group information for each species (Table 3).
Summary of scaffold group information assignment for Hawaiian Drosophila species

Gene Prediction and Annotation
Protein-coding genes were predicted using MAKER2 [Holt and Yandell, 2011], which used D. melanogaster protein sequences from FlyBase (r6.02, http://flybase.org) as protein homology evidence, and integrated with prediction methods including BLASTX, SNAP [Korf, 2004], and AUGUSTUS [Stanke and Waack, 2003]. In order to further increase the accuracy of gene prediction, we included the RNA-seq data to the prediction process. RNA-seq data for D. silvestris, D. heteroneura,and D. planitibia were downloaded from NCBI Gene Expression Omnibus (GEO, www.ncbi.nlm.nih.gov/geo) under accession number GSE80124 and from our previous study [Brill et al., 2016]. Adapters were removed from the raw sequencing reads. Duplicated and low-quality reads were discarded using FastqMcf [Aronesty, 2013] with default parameters. To minimize possible contamination, reads were aligned to the NCBI bacterial database, and only unmapped reads were kept to assemble the transcriptome. The processed reads from each species were merged together and assembled with Trinity [Grabherr et al., 2011] (with parameter “-trimmomatic”). The assembled RNA-seq data were input to the MAKER2 pipeline as EST evidence. Predicted genes were subsequently used as query sequences in a blastx database search of NR database (non-redundant database, http://www.ncbi.nlm.nih.gov/). Blastx alignments with e-value greater than 1e-10 were discarded, and the top hit (or top hit from Drosophila species if existed) was used to annotate the query genes.
Genome Completeness
Two methods were used for genome completeness estimation. CEGMA [Parra et al., 2007] examines the existence of 248 core eukaryotic genes in the assembly. BUSCO [Simão et al., 2015] was used to assess universal single-copy orthologs of eukaryotes in the assembly.
Ka/Ks Ratio
In order to reduce the possible impact of gene mis-annotations on the Ka/Ks (or dN/dS) ratio, we used only annotations against Swissprot (http://www.ebi.ac.uk/uniprot). Blastx alignments with e-values greater than 1e-40 or identity <40% were discarded. D. grimshawi was used as an outgroup, sequences with the same annotation were grouped together, and Clustal-omega [Sievers et al., 2011] was used to conduct the multiple sequence alignments. Nucleotide sequences were parsed to amino acid sequences before carrying out multiple-sequence alignments to avoid possible frameshifts, and the amino acid sequences of the alignment were changed back to nucleotide sequences for Ka/Ks calculations. PAML [Yang, 2007] (version 4.7) was used to calculate the pairwise Ka/Ks ratio values, setting the model = 0 in the control file of codeml. To further minimize the possible effect of wrong annotations and grouping, Ks values >2 were excluded from further analyses, and the maximal Ka/Ks value was set to be 3. Models M7/M8 along with likelihood ratio tests were applied to test for the significance of positive selection, with p values generated from χ2 distribution [Nielsen and Yang, 1998].
Results
Genome Completeness and Annotation
The pre-assembled genomes were assessed for their completeness with 2 methods, CEGMA [Parra et al., 2007] and BUSCO [Simão et al., 2015] (online suppl. Tables 1, 2; see www.karger.com/doi/10.1159/000481790 for all online suppl. material). The number of contigs for the 3 assemblies ranged from 6,692 (D. silvestris) to 15,471 (D. planitibia), with the average completeness of 95.43% and 89.51% by CEGMA and BUSCO, respectively. Among the 3 species, D. planitibia had the largest assembled genome size of 189 Mb, while D. silvestris had the smallest assembled genome size of 146 Mb. The numbers of predicted protein-coding genes ranged between 10,919 (D. heteroneura) and 12,746 (D. planitibia), correlating with their genome sizes (online suppl. Table 3). More than 97% of the predicted genes could be annotated against the non-redundant protein database.
Chromosome Isolation and Sequencing
A total of 24 chromosome samples from 3rd instar larvae of D. differens, an endemic species from Molokai (sister species to D. planitibia from Maui), were isolated and sequenced (Fig. 1). An average of 10,410,225 reads or 1,405,892,022 bp were generated for each sample. After a stringent quality control, including tests for interchromosomal contamination, as well as foreign DNA contamination, only 12 samples were used for chromosome mapping and further analysis (Table 2; see Materials and Methods). The majority of reads from each of the 12 samples were mapped to a single Muller element using D. melanogaster as a reference, with the ratio of the highest count and the second highest count >10 (Fig. 2; Table 2).
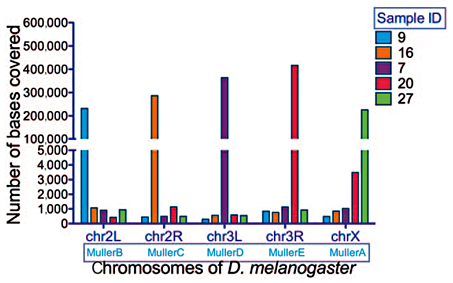
Mapping of reads from LCM samples against Drosophila melanogaster chromosomes.
Mapping Scaffolds to Chromosomes
The 12 samples were then merged into 5 groups corresponding to Muller elements, based on chromosomal synteny. Reads from each group were merged and mapped against each assembly from each species separately. Scaffolds from each assembly were assigned a Muller element label if stringency criteria were met (see Materials and Methods). More than 68% (68.46-84.21%) of the scaffolds were successfully assigned with Muller element labels (Table 3). Merging scaffolds into LCM-derived chromosomes according to their Muller element labels, and mapping the chromosomes from each species against the D. melanogaster chromosomes generated a general chromosomal alignment (Fig. 3). A large proportion of each LCM-derived chromosome successfully mapped to a single D. melanogasterchromosome, confirming the validity of the method, as well as high chromosomal synteny between Hawaiian Drosophila and D. melanogaster. “Aberrant” alignments across chromosomes likely indicate chromosomal and structural rearrangement events after the split from the common ancestor with D. melanogaster. Interchromosomal contamination cannot be completely ruled out as a source of the pattern of spurious structural rearrangements, but we note that DNA contamination tends to be magnified through whole-genome amplification and is thus relatively easy to detect and eliminate at the sample level.

Circos diagrams showing genomic synteny of Hawaiian Drosophila with D. melanogaster. Links were created based on the alignment results between D. heteroneura (A), D. silvestris (B), and D. planitibia (C) and D. melanogaster (reference in A-C) using Blastn. Alignments spanning less than 100 bp were discarded.
Circos diagrams showing genomic synteny of Hawaiian Drosophila with D. melanogaster. Links were created based on the alignment results between D. heteroneura (A), D. silvestris (B), and D. planitibia (C) and D. melanogaster (reference in A-C) using Blastn. Alignments spanning less than 100 bp were discarded.
A Preliminary Test for Faster-X Chromosome Evolution
Even though the scaffolds within LCM-derived chromosomes were not ordered, information on approximate chromosome mapping is useful for addressing a variety of questions, such as those related to sex chromosomes versus autosomes. We asked a question about the relative rate of interspecies sequence divergence of the X chromosome. Faster-X evolution was proposed to occur due to selection of recessive or partially recessive mutations being more efficient on the X chromosome than on the autosomes [Charlesworth et al., 1987]. We tested whether X-linked genes accumulate more substitutions than autosomal genes by calculating the Ka/Ks ratio and using D. grimshawi as an outgroup. The average synonymous-substitution rate Ks values of X-linked genes were greater than those of autosomal genes in 2 out of 3 species with the exception of D. heteroneura (Fig. 4). As Ks is usually considered to reflect nonadaptive changes, a greater Ks of X-linked genes is expected due to the smaller effective population size (Ne) of X-linked relative to autosomal genes. The Ka/Ks values were also greater in X-linked genes compared to autosomal genes in D. planitibia(Mann-Whitney-Wilcoxon test, p = 0.049) and D. silvestris(p = 0.804), overall consistent with the faster-X chromosome divergence. However, more robust approaches, such as McDonald-Kreitman tests, will be required to further examine this phenomenon in Hawaiian Drosophilaspecies, based on multiple individuals being sequenced for each species.

Relative rates of Ks and Ka/Ks between autosomal genes and X-linked genes. Ks is indicated by asterisks, Ka/Ks by triangles with Drosophila heteroneura rates in purple, D. silvestris in red, and D. planitibia in green.
Relative rates of Ks and Ka/Ks between autosomal genes and X-linked genes. Ks is indicated by asterisks, Ka/Ks by triangles with Drosophila heteroneura rates in purple, D. silvestris in red, and D. planitibia in green.
Discussion
LCM is a powerful technique that permits rapid dissection and isolation of tissues, cells, organelles, chromosomes, and their fragments. It allows accurate investigation of subcellular or tissue-specific profiles, including disease-associated ones, especially when combined with PCR amplification, gene expression assays [Emmert-Buck et al., 1996; Nakazono et al., 2003], proteomic analysis [Xu et al., 2002], enzyme recovery from LCM-transferred tissue [Emmert-Buck et al., 1996], or even profiling at the single-cell level [Kamme et al., 2004; Keays et al., 2005]. The proposed approach of mapping scaffolds to chromosomes using LCM is a fast and cost-efficient way for acquiring chromosomal information for draft genome assemblies, avoiding likely errors of reference- or synteny-based approaches. The LCM-based approach enables rapid downstream chromosome-related analyses, essentially along with the de novo genome assembly construction, and it can aid in chromosome mapping that integrates genetic and physical maps by pre-classifying scaffolds into different categories.
We exemplify the utility of the approach in application to a test for faster-X chromosome evolution [Charlesworth et al., 1987]. Although the X chromosome is usually similar to the autosomes in size and cytogenetic appearance, theoretical models predict that the hemizygosity of males may cause unusual patterns of evolution in the X chromosome [Vicoso and Charlesworth, 2006]. Tests for faster-X chromosome evolution in Drosophila and mammals have been largely inconclusive, necessitating more research [Meisel and Connallon, 2013]. Early studies of the faster-X evolution in coding sequences of Drosophila species led to contradictory results [Betancourt et al., 2002; Thornton and Long, 2002; Thornton et al., 2006], but increasingly more studies tend to support this phenomenon [Charlesworth and Campos, 2014; Veeramah et al., 2014]. Newer studies also include a wider taxonomical spectrum, and include human, mouse, and birds [Kousathanas et al., 2014; Wang et al., 2014; Dean et al., 2015; Wright et al., 2017]. In addition to sequence divergence, divergent gene expression patterns in Drosophila and mammals are also pronounced among X-linked genes [Hu et al., 2013; Kousathanas et al., 2014]. The analysis of the relative divergence rates between X-linked genes and autosomal genes in Hawaiian Drosophila, a group that has undergone rapid adaptive radiation, is thus of special interest. In 2 of the 3 species (D. planitibia and D. silvestris), Ka/Ks ratios were higher among X-linked genes. Ka/Ks estimates in the third species, D. heteroneura, are likely affected by drift effects, for this is a species with smaller effective population size [Kang et al., 2016]. Further effort to sequence and analyze other species of Hawaiian Drosophila is evidently needed to confirm this pattern in a broader and statistically more rigorous framework.
Caution is recommended when the LCM-based method is applied to the detection of structural chromosome changes, such as translocations, given the relatively high rate of DNA contamination we observed. Cross-chromosome contamination may occur during microdissections. Therefore, care should be taken when dissecting a chromosome if material of another chromosome is nearby. The unwanted chromosomal material should be removed by the laser before proceeding to dissection of the target chromosome. Also, a misidentified chromosome arm or unnoticed attached fragment of another chromosome could create the pattern in which materials from different chromosomes are in the same sample. For this reason, familiarity with the chromosome banding pattern can be important.
The LCM technique, combined with NGS, can be applied to organisms without polytene chromosomes as long as the size of the chromosomes is large enough to meet the PicoPlex kit requirement of 6-60 pg of DNA input. Species with only microchromosomes may not be suitable for such studies until further progress in extraction of low-quantity DNA is made. Any species from such genera as Chironomus, Anopheles, Drosophila, Calliphora, and other dipterans, containing polytene chromosomes can be used in a similar study.
Acknowledgements
Ken Kaneshiro kindly provided D. differens. The work on chromosome microdissection was supported by the Fralin Life Science Institute and the USDA National Institute of Food and Agriculture Hatch project 223822 to I.S.
Statement of Ethics
The authors have no ethical conflicts to disclose.
Disclosure Statement
The authors have no conflicts of interest to declare.
