

Abstract
Background: Metabolic complications of type 2 diabetes (T2DM), including dyslipidemia, electrolyte imbalance, and oxidative stress, have been shown to be modulated by hypoglycemic agents. Objective: The lipid profile, electrolytes, and oxidative stress indices were evaluated in T2DM. Methods: Fifty T2DM patients on metformin (n = 23), insulin (n = 17), and insulin/metformin (n = 10) and 40 controls were studied. Fasting plasma glucose (FPG), glycated hemoglobin (HbA1c), total cholesterol (TC), triglyceride (TG), high-density lipoprotein cholesterol (HDL-C), total antioxidant capacity (TAC), total plasma peroxide (TPP), and total calcium (Ca) values were determined colorimetrically, sodium (Na+) and potassium (K+) levels were determined by flame photometry, chloride (Cl–) and bicarbonate (HCO3–) levels were determined by titration, and low-density lipoprotein cholesterol (LDL-C) levels, the atherogenic index of plasma (AIP), and the oxidative stress index (OSI) were determined by calculation. Data were analyzed using t test, analysis of variance, and Pearson’s correlation at p < 0.05. Results: T2DM patients had higher lipid peroxidation (TPP and OSI), atherogenic lipids (higher LDL-C and AIP and lower HDL-C), and lower antioxidants compared to controls (p < 0.05). T2DM patients with poor glycemic control had higher lipid peroxidation (higher TPP) and atherogenic lipids (TG and AIP) compared to those with good control (p < 0.05). Patients with T2DM for >5 years had higher protein glycosylation (higher HBA1c) and TC compared to those with T2DM for <5 years (p < 0.05). The class of hypoglycemic agent has no effect on the levels of all of the biochemical indices studied (p > 0.05). HDL-C correlated negatively with TG (r = –0.347, p = 0.013), LDL-C (r = –0.322, p = 0.018), and AIP (r = –0.714, p = 0.000) in T2DM. Conclusion: Chronic T2DM and poor glycemic control are associated with reduced antioxidants, lipid peroxidation, and atherogenic dyslipidemia. Different hypoglycemic agents exert no differential effects on the metabolic indices of T2DM studied.
Introduction
Type 2 diabetes (T2DM) has been shown to account for over 90% of all cases of diabetes mellitus and is commonly associated with a myriad of metabolic consequences including dyslipidemia, hypertension, metabolic syndrome, and atherosclerosis [1]. Chronic hyperglycemia associated with T2DM induces increased generation of free radicals such as reactive oxygen species (ROS), and the accruing oxidative stress has been described as the major pathophysiologic factor linking the progression of T2DM and associated complications [2]. Increased ROS production in T2DM has also been linked to hyperinsulinemia and impaired insulin action, thus forming a vicious cycle [3]. Hyperinsulinemia has been associated with elevated triglyceride (TG) levels. Hypertriglyceridemia is metabolically associated with a preponderance of low-density lipoprotein cholesterol (LDL-C) particles and decreased high-density lipoprotein cholesterol (HDL-C) [4, 5]. Dyslipidemia, characterized by elevated TG and LDL-C levels and low HDL-C levels, has been shown to affect almost 50% of T2DM patients [6]. Hyperglycemia and hyperketonemia also accruing from an insulin deficiency in T2DM have been associated with electrolyte imbalance [7]. Improved glycemic control has been associated with a reduction in these metabolic complications in T2DM [2].
The management of T2DM includes routine monitoring of blood glucose levels and lifestyle changes in combination with pharmacological therapy. The most common therapy for treatment of T2DM involves the use of hypoglycemic agents (sulfonylureas, nonsulfonylureas, secretagogues, biguanides, and thiozolidinediones), lipid-lowering agents, and antihypertensive medications [1]. Some of these drugs have been shown to exhibit antioxidant properties and pleiotropic effects in cell culture, experimental animals, and human trials [8]. Variations in the mechanisms of action of these drugs may also result in their differential effects on various metabolic processes in T2DM, which may also reflect on the levels of some biochemical indices used in diagnosis and monitoring of diabetes progression. These effects may influence the choice of pharmacological therapy in T2DM to suit an individual’s clinical outcome. The differential effects of insulin, metformin, and insulin metformin combination therapy on biomarkers of oxidative stress, electrolytes, and cardiovascular risk factors were determined in type 2 diabetics.
Materials and Methods
Study Design
This case-control study which examined the influence of metabolic control and differential effects of hypoglycemic agents on biomarkers of oxidative stress, electrolytes, and cardiovascular risk factors in T2DM, was carried out at the University of Calabar Teaching Hospital (UCTH), Calabar, Cross River State, Nigeria.
Selection of Subjects
The study population comprised 50 subjects (aged 35–60 years) with known T2DM for at least the past 1 year and 40 age-matched apparently healthy non-diabetics according to the World Health Organization diagnostic criteria for diabetes [9]. The subjects of the study population were selected by convenience sampling. T2DM subjects were diagnosed on the basis of laboratory findings of fasting plasma glucose (FPG) levels >7.0 mmol/L on 2 or more occasions or 2-h postprandial plasma glucose levels >11.0 mmol/L on 2 or more occasions. The duration of T2DM is the time since the diagnosis of diabetes. Socio-demographic characteristics of the study population, including family history, medical history, medication, parity, occupation, physical activity, and lifestyle patterns such as smoking and alcohol consumption, were obtained using a semi-structured questionnaire. Anthropometric indices such as height, weight, and hip and waist circumference were determined in order to calculate the BMI and waist-to-hip ratio, respectively. Blood pressure was also measured to rule out hypertension.
Subjects with T2DM under medication (metformin, insulin, or metformin/insulin) in the age group of 35–60 years (test subjects) and apparently healthy age-matched non-diabetics (controls) were included in this study. Subjects who were pregnant, hypertensive, or had any form of chronic organ or systemic illness and prolonged medication use other than oral hypoglycemic agents and insulin were excluded from this study.
Sample Collection
After an overnight fast, 6 mL of fasting venous whole blood samples were collected aseptically from each subject via venipuncture. Two milliliters of the blood (each) was transferred into a fluoride oxalate bottle and a K2EDTA bottle for plasma glucose estimation and glycated hemoglobin (HbA1c) estimation, respectively. The remaining 2 mL was allowed to clot and retract and then centrifuged at 500 gfor 10 min at room temperature. Serum samples were collected for laboratory estimation of electrolytes (Ca, Na, K, Cl, and HCO3-), oxidative stress indices (total antioxidant capacity [TAC] and total plasma peroxide [TPP]) and lipid profiles (TC, LDL-C, TG, and HDL-C).
Laboratory Methods
Estimation of FPG
FPG was estimated using a glucose oxidase enzymatic colorimetric kit from Giesse (Italy) [10].
Estimation of HbA1c
Glycohemoglobin was estimated using the column chromatographic method with cation exchange resin kits from Teco Diagnostics (USA) [11].
Estimation of the Lipid Profile
TC and TG were determined using the enzymatic colorimetric method [12, 13]. The test kits were obtained from EliTech Clinical Systems (France).
HDL-C was determined using the precipitation cholesterol enzymatic method [14]. The test kits were obtained from EliTech Clinical Systems.
The LDL-C concentration was calculated from the TC concentration, the HDL-C concentration, and the TG concentration using the formula of Friedewald et al. [15]:
LDL-C (mmol/L) = TC – HDL-C – (TG/2.2)
The atherogenic index of plasma (AIP) was calculated from the concentrations of TG and HDL-C using the following formula [16]:
AIP = log [TG (mmol/L)/HDL-C (mmol/L)]
Estimation of Electrolytes
Determination of sodium and potassium was done by flame photometry [17]. Chloride and bicarbonate were determined using titrimetric colorimetric methods [18, 19]. Total calcium was estimated using the modified O-cresolphthalein complexone method [20].
The anion gap was calculated by subtracting the serum concentrations of chloride and bicarbonate (anions) from the concentrations of sodium and potassium (cations) as follows:
Anion gap = ([Na+] + [K+]) − ([Cl−] + [HCO3-]) in mEq/L or in mmol/L [21].
Estimation of Biomarkers of Oxidative Stress
The TAC of the sample was estimated by measuring thesuppression of the production of thiobarbituric acid reactive substances from benzoate by antioxidants in the sample and inhibition of color development at 532 nm [22].
The TPP is estimated when serum peroxide in the sample oxidizes ferrous-butylated hydroxytoluene-xylenol orange complex (FOX-2 reagent) to yield a colored ferric xylenol orange complex that is measured at 560 nm [23].
The oxidative stress index (OSI)was calculated as the ratio of TPP to TAC, an indicator of the degree of oxidative stress, as follows: OSI (%) = [TPP (H2O2 μM) × 100]/[TAC μM] [23].
The NO was estimated by the Griess test, where the NO-containing compounds in the serum combine with α-naphthylamine to produce a pink azo dye the absorbance of which is measured at a wavelength of 540 nm. Total nitrite and nitrate levels were represented as total nitric oxide metabolites (NOx) and the measurement of NOx is considered a direct marker of in vivo NO production [24].
Reduced glutathioneestimation was carried out using the modified standard Ellman method where glutathione reacts with 5, 5′-dithiobis (2-nitrobenzoic acid) (DTNB, Ellman’s reagent) to form the chromophore 5-thionitrobenzoic acid (TNB) and GS-TNB which is measured at 412 nm [25].
Malondialdehyde formed from the breakdown of polyunsaturated fatty acid serves as a convenient index for determining the extent of the peroxidation products that react with thiobarbituric acid to give a red species absorbing at 532 nm [26].
Data Analysis
Results were presented as means ± SD. Data were analyzed using the Statistical Package for the Social Sciences (SPSS version 20.0; IBM, USA). Analysis of variance (ANOVA) was used to test variations within and among group means and Fisher’s least significant difference (LSD) post hoc test was used for comparison of multiple group means. Pearson’s correlation was used to determine associations between variables. p < 0.05 was considered statistically significant.
Results
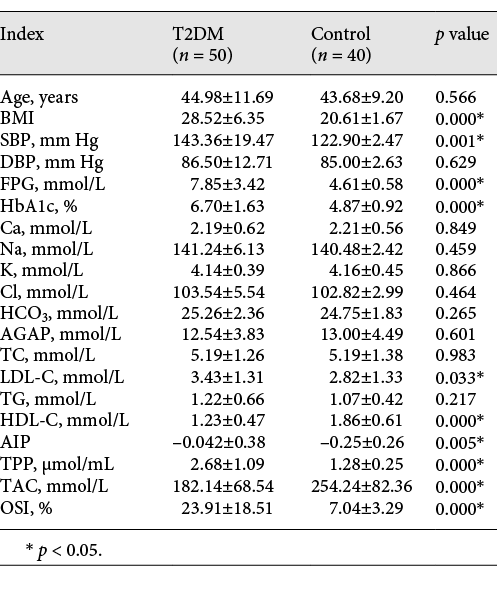
Table 1 shows the age, cardiovascular risk factors (BMI, systolic blood pressure [SBP], diastolic blood pressure [DBP], FPG, HbA1c, TC, LDL-C, TG, HDL-C, and AIP), electrolytes (Ca, Na, K, Cl, HCO3-, and anion gap [AGAP]), and oxidative stress indices (TAC, TPP, and OSI) in type 2 diabetics and controls. BMI, SBP, FPG, HBA1c, TPP, OSI, LDL-C, and AIP were significantly higher and TAC and HDL-C were lower in diabetics compared to non-diabetics (p < 0.05).
Age, cardiovascular risk factors, electrolytes, and oxidative stress indices in type 2 diabetics and controls
The effect of glycemic control on cardiovascular risk factors (BMI, SBP, DBP, FPG, HbA1c, TC, LDL-C, TG, HDL-C, and AIP), electrolytes (Ca, Na, K, Cl, HCO3, and AGAP), and oxidative stress indices (TAC, TPP, and OSI) in type 2 diabetics are depicted in Table 2. T2DM patients with poor glycemic control (HbA1c >8.0%) had higher TPP, TG, and AIP and lower Ca compared to those with good control (HbA1c <8.0%) (p < 0.05).
Effect of glycemic control on cardiovascular risk factors, electrolytes, and oxidative stress indices in type 2 diabetics

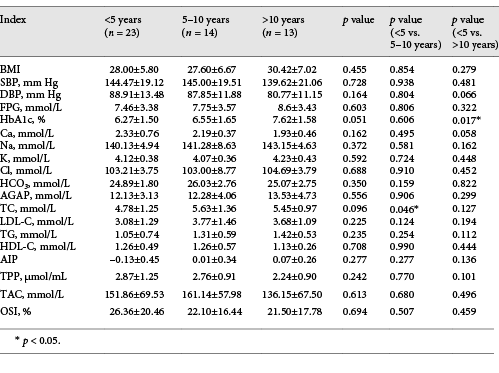
Table 3 shows the effect of duration of diabetes on cardiovascular risk factors (BMI, SBP, DBP, FPG, HbA1c, TC, LDL-C, TG, HDL-C, and AIP), electrolytes (Ca, Na, K, Cl, HCO3, andAGAP), and oxidative stress indices (TAC, TPP, and OSI) in type 2 diabetics. Higher HBA1c and TC were observed in patients with a duration of diabetes >5 years compared to those with a duration <5 years (p < 0.05).
Effect of duration of diabetes on cardiovascular risk factors, electrolytes, and oxidative stress indices in type 2 diabetics
The effect of different hypoglycemic agents on cardiovascular risk factors (BMI, SBP, DBP, FPG, HbA1c, TC, LDL-C, TG, HDL-C, and AIP), electrolytes (Ca, Na, K, Cl, HCO3, andAGAP), and oxidative stress indices (TAC, TPP, and OSI) in type 2 diabetics are shown in Table 4. No significant variations were observed in any of the indices among the 3 therapy groups studied (metformin, insulin, and insulin/metformin combination) (p > 0.05).
Effect of different hypoglycemic agents on cardiovascular risk factors, electrolytes, and oxidative stress indices in type 2 diabetics

Figure 1 shows the correlation plot of TG against HDL-C in the type 2 diabetics studied. A significant negative correlation was observed between TG and HDL-C (r = –0.347, p = 0.013).

Figure 2 shows the correlation plot of LDL-C against HDL-C in the type 2 diabetics studied. A significant negative correlations was observed between LDL-C and HDL-C (r = –0.322, p = 0.018).

Figure 3 shows the correlation plot of AIP against HDL-C in the type 2 diabetics studied. A significant negative correlations was observed between AIP and HDL-C (r = –0.714, p = 0.000).

Discussion
Chronic hyperglycemia, which characterizes T2DM, results in generation of ROS and OS which has been implicated in the pathologic mechanisms underlying the development of most diabetic complications. Hypoglycemic agents used in the management of T2DM have been shown to ameliorate some of the metabolic consequences of T2DM and impede the development of these complications. This has been attributed to the antioxidant property of these hypoglycemic agents. The effect of different classes of hypoglycemic agents on biomarkers of oxidative stress, electrolytes, and cardiovascular risk factors in T2DM were determined in this study.
In this study, the BMI, FPG, HbA1c, TPP and OSI were significantly higher and TAC lower in T2DM patients on hypoglycemic therapy compared to non-diabetic controls. T2DM is a metabolic disorder of multiple etiologies characterized by chronic hyperglycemia resulting from insulin deficiency, insulin resistance, or both, leading to impairment in carbohydrate, fat, and protein metabolism. The ensuing elevated blood glucose levels in T2DM are therefore a consequence of the failure of insulin-induced glucose uptake by fat and muscle cells [27]. Chronic hyperglycemia induces and accelerates non-enzymatic glycosylation and oxidation of lipids, nucleic acids, proteins, and hemoglobin, leading to the formation of early, intermediate, and advanced glycation end products including HbA1c; this accounts for the higher levels of HbA1c seen in T2DM [5]. HbA1c has proven to be a useful index for monitoring the efficacy of glycemic control over a previous 3-month period (corresponding to the life span of typical hemoglobin) and predicting the development of various diabetic complications. Higher HbA1c levels have also been associated with higher levels of markers of inflammation [28]. Higher levels of TPP and OSI and lower levels of TAC were observed in T2DM patients compared to non-diabetic controls. Insulin resistance, hyperinsulinemia, and chronic hyperglycemia in T2DM have been shown to induce increased generation of ROS, leading to increased peroxidation of biomolecules and oxidative stress.Mechanisms involving glucose autoxidation, hyperglycemia, enhanced formation of advanced glycation end products, polyol and hexosamine pathways, and activation of protine kinase C and poly-ADP ribose polymerase pathways that enhance overproduction of mitochondrial superoxide have been implicated in increased ROS in T2DM [28, 29]. Thus the higher ROS generation and increased lipid peroxidation in T2DM may be responsible for the lower TAC and higher TPP and OSI seen in T2DM. Oxidative stress and oxidative tissue damage play significant roles in micro- and macrovascular diabetic complications [28].
A higher SBP was observed in T2DM patients compared to controls. Insulin has been shown to exhibit a pleiotropic vascular effect which may be protective or deleterious to the vascular endothelium [30]. Insulin resistance, hyperinsulinemia, and hyperglycemia, which characterize T2DM have been implicated in abnormalities in vascular function (vascular stiffness, vasoconstriction, hypertrophy, fibrosis, and remodeling), pro-inflammation, increased sodium and water retention, promotion of sympathetic nerve activity, and elevation of blood pressure [30]. Increased ROS and OS in T2DM contribute to a high blood pressure via endothelial dysfunction by direct tissue injury, reduction of the bioavailability of NO, and impairment of NO mediated vasodilation. Hypertension in T2DM is the leading risk factor for atherosclerosis and its complications, including heart attack and stroke [31].
Type 2 diabetics had higher LDL-C and AIP and lower HDL-C compared to non-diabetic controls. Metabolic disturbances characterized by a spectrum of quantitative and qualitative changes in lipids and lipoproteins (hypertriglyceridemia, elevated LDL-C, and low HDL-C), inflammation, endothelial dysfunction, and hypertension related to hyperglycemia and hyperinsulinemia are rife in T2DM [1, 4]. The decreased HDL-C levels observed in T2DM have been attributed to increased catabolism of HDL-C particles as a result of an increase in the activity of hepatic lipase responsible for catabolism of HDL-C which is augmented in insulin resistance [32]. Increased catabolism of HDL-C in insulin resistance and T2DM has been linked to mechanisms leading to an increased pool of TG-rich lipoproteins (mainly VLDL-C), which promotes cholesteryl ester transfer protein-mediated triacylglycerol enrichment of HDL-C particles and, as a consequence, enhanced HDL catabolism since HDL rich particles are very good substrates for hepatic lipase [32]. The elevated LDL-C levels observed in T2DM may be due to the substantial reduction in catabolism of LDL inducing a longer duration of LDL in plasma, which may promote deposition on the arterial walls [33]. Insulin has been shown to promote clearance of LDL by increasing LDL receptor expression and activity [33]. Therefore, in insulin resistance and T2DM, the number of LDL apo-E cell surface receptors is significantly reduced, which may be due to a reduced insulin-mediated expression and could be responsible for the observed impairment in LDL catabolism, hence the elevated LDL-C levels in T2DM [33]. Higher TG and low HDL-C levels are responsible for the higher AIP observed in T2DM. Elevated LDL-C is the major factor implicated in the development of cardiovascular disease in T2DM.
Higher levels of TPP, TG, and AIP were observed in T2DM patients with poor glycemic control compared to those with good glycemic control. Hypertriglyceridemia has been described as the most common lipid abnormality in the diabetic population, and insulin resistance has been correlated with TG levels [5]. The insulin resistance, decreased insulin function, and relative insulin deficiency in T2DM inhibits lipolysis and lipoprotein lipase activity. The FFA flux into glycogen-rich hepatocytes triggers TG synthesis, which in turn stimulates synthesis and secretion of VLDL, leading to an increase in TG-rich particles in circulation [34]; this condition is aggravated in conditions of poor glycemic control. Uncontrolled T2DM is associated with increased lipid peroxidation and oxidative stress – all the more so in conditions of poor metabolic control. Higher levels of lipid peroxidation products and TG have been described in T2DM patients with poor glycemic control [34]. Improved glycemic control has been shown to have favorable effects on lipoprotein levels in DM, with a reduction in cholesterol and TG levels through increased catabolism of VLDL and LDL-C, reduced glycation, and upregulation of LDL receptors [35]. Good glycemic control may therefore impede the development of complications of T2DM [27].
The electrolyte profiles of T2DM were comparable with those of non-diabetics. Contrary to our findings, disturbances in the homeostasis of water and some electrolytes resulting from insulin deficiency, hyperglycemia, and hyperketonemia have been associated with T2DM [4, 36]. Electrolyte disturbances in T2DM have been attributed to a hyperglycemia-induced osmotic fluid shift or a total body water deficit as a result of osmotic diuresis, leading to an altered distribution of electrolytes. Other factors that have been implicated in electrolyte imbalance include pharmacological therapies used in the management of diabetes and complications from end organ injury. Pseudohyponatremia has been linked to marked hypertriglyceridemia in T2DM. Hyperkalemia in T2DM has been attributed to a redistribution of potassium that results from hypertonicity and insulin deficiency [36]. Hyperglycemia has been shown to cause an acute rise in cytosolic calcium due to increased calcium influx and mobilization of intracellular calcium from calcium stores [37]. However, such electrolyte imbalances were not observed in this study.
Higher HBA1c and TC were observed in patients with a duration of T2DM >5 years compared to those with a duration <5 years. Metabolic disturbances in T2DM have been shown to be dependent on the acute fluctuations of glucose over a daily period and the duration and magnitude of chronic sustained hyperglycemia [38]. Chronic hyperglycemia is associated with early, intermediate, and advanced glycosylation of lipids, proteins, and hemoglobin, which has been useful in monitoring blood glucose and predicting the development of diabetic complications. Increasing duration of diabetes has been associated with a higher incidence of dyslipidemia and associated complications [37].
Metformin, insulin, and metformin/insulin therapies did not seem to exert any differential effect on any of the studied biochemical indices in T2DM. This is consistent with previous reports where no differences were observed for TC, TG, HDL-C, or LDL-C among the study groups using different hypoglycemic agents, i.e., sulfonlyurea, biguanide, insulin/insulin analogs, and sulfonylurea in combination with biguanide [39]. However, long-term treatment of T2DM with oral antidiabetic agents, insulin, lipid- or cholesterol-lowering drugs, and antihypertensive drugs has been shown to optimize the lipid profile and seems to be helpful in the prevention of lipid peroxidation [40].
Conclusion
T2DM is associated with reduced antioxidants, increased lipid peroxidation, and moderate elevation of LDL-C, which may predispose to oxidative stress and the development of atherosclerosis. Different classes of hypoglycemic agents have no differential effect on the metabolic indices studied, while poor glycemic control and an increasing duration of diabetes may aggravate metabolic disturbances in type 2 diabetics.
Acknowledgement
The authors are grateful to the staff and students of the outpatient clinic of the Department of Internal Medicine, University of Calabar Teaching Hospital, for their support in recruiting the subjects of this study.
Statement of Ethics
Informed written consent was obtained from subjects before recruitment into this study. The Cross River State Ministry of Health Ethical Committee approved the study protocol. This study was carried out in accordance with the ethical principles for medical research involving human subjects as outlined in the Helsinki Declaration in 1975 and subsequent revisions.
Disclosure Statement
The authors declare that there is no conflict of interests regarding the publication of this paper.
Funding Sources
There was no form of financial support for this study.
Author Contributions
All authors participated in the conception and design of this study and read and approved the final version of this paper.
References

