

Abstract
Background/Aims: Obesity and high salt intake are major risk factors for hypertension and cardiometabolic diseases. Obese individuals often consume more dietary salt. We aim to examine the neurophysiologic effects underlying obesity-related high salt intake. Methods: A multi-center, random-order, double-blind taste study, SATIETY-1, was conducted in the communities of four cities in China; and an interventional study was also performed in the local community of Chongqing, using brain positron emission tomography/computed tomography (PET/CT) scanning. Results: We showed that overweight/obese individuals were prone to consume a higher daily salt intake (2.0 g/day higher compared with normal weight individuals after multivariable adjustment, 95% CI, 1.2-2.8 g/day, P < 0.001), furthermore they exhibited reduced salt sensitivity and a higher salt preference. The altered salty taste and salty preference in the overweight/obese individuals was related to increased activity in brain regions that included the orbitofrontal cortex (OFC, r = 0.44, P= 0.01), insula (r = 0.38, P= 0.03), and parahippocampus (r = 0.37, P= 0.04). Conclusion: Increased salt intake among overweight/obese individuals is associated with altered salt sensitivity and preference that related to the abnormal activity of gustatory cortex. This study provides insights for reducing salt intake by modifying neural processing of salty preference in obesity.
Introduction
Obesity and high salt intake have become a significant health problem worldwide, which are major risk factors for hypertension. Furthermore, overweight and obese individuals are prone to consume more dietary salt, and their BMI are correlated with increased salt intake [1, 2]. In addition, high salt intake increasing blood pressure has been shown in obese subjects, and modification of salt sensitivity through therapeutic weight reduction can lower blood pressure [3, 4]. However, the underlying mechanisms on obesity related high salt intake remain elusive. The overeating of palatable foods is a major cause of obesity, and taste perception is pivotal to appetite and food choices [5]. Altered sensitivity and preference for sweet, fatty, bitter, and umami taste have been reported in both humans and rodents with or without obesity [6-8]. However, few studies have investigated salty preference in an obese population. It is well known that the central gustatory system and the mesolimbic structures are critical for taste signal processing and hedonic responses to foods. Functional neuroimaging studies show that elevations in BMI are related to changes in brain regional activity such as the hypothalamus, amygdala, prefrontal cortex, orbitofrontal cortex (OFC), insula cortex, and hippocampus/parahippocampus [9, 10], most of which are involved in the perception of salty taste. Recent optogenetic approaches have been developed to further decipher the role of cortical neurons within circuits [11].
How to reduce high salt intake is vital for preventing hypertension and obesity related cardiovascular events [12]. Currently, several strategies for reduction in high salt intake, such as recommendations for dietary sodium restriction and the use of NaCl substitutes, are poor compliance at the population level although great efforts have been made [13, 14]. Modifying the salty preference might be an alternative strategy for reducing high salt intake [15]. Palatability is the consequence of stimulation of brain reward pathways, which indicates that individual’s salty preference might be associated with the neural hedonic properties of the salted foods [16]. In this study, we hypothesized that alterations in brain activity in response to salty taste are responsible for high salt intake in obese individuals. To test this hypothesis, we first examined the relationship between high salt intake and obesity by performing a multiple center human study. Then, we investigated changes in the salty taste response of the brain by PET/CT scanning of the participants.
Materials and Methods
Trial Registration
ClinicalTrials.gov, Identifier: NCT01982669. URL: http://www.clinicaltrials.gov.
Overview of the study design and participants
Participants were recruited for a cross-sectional study (SATIETY-1) from the following four cities in China: Shenyang, Jinan, Chengdu and Chongqing (NCT01982669). In addition, an interventional study of brain PET/CT scanning was conducted in Chongqing. All of the participants signed an informed consent prior to the start of trials. The protocol was approved by the Ethics Committee at Daping Hospital at the Third Military Medical University.
All of the participants in this study were required to be between 18 and 65 years of age, and to able to comply with all study procedures. The exclusion criteria were as follows: hypogeusia or loss of taste due to neural system disease or oral and digestive disease; capsaicin allergy; poor compliance; recent use of oral diuretics; participation in other pharmacological trials within the past 3 months; acute infection, cancer; serious arrhythmias; drug or alcohol abuse; currently achieve cold, fever, acidosis, dehydration, diarrhea, or vomiting during the course of the study; unwilling or unable to communicate due to the dysnoesia and language disorders; severe neural or psychiatric diseases that would preclude full understanding and cooperation in the study; pregnancy or lactation; and an unwillingness to sign the informed consent. As specific requirements for enrollment in the interventional study, participants had to declare that they had no history of taste/smell/neurological disorders, brain tumor, epilepsy, or allergic reaction to 18F-FDG.
SATIETY-1 (Spicy Diet on Salty Taste and Salt Intake)
This was a multi-center, random-order, double-blind taste study conducted to investigate salty taste and salt intake at the population level. This study aimed to explore these factors in participants who liked or disliked spicy food using questionnaires and assessments of spicy preference and salty perception and super-threshold. In total, 537 eligible participants’ data were analyzed in this study, and the participants were subdivided into normal weight (156 men, mean age of 37.8 ± 10.4 years old) and overweight/obesity (100 men, mean age of 43.7 ± 8.4 years old) groups based on their body mass index (BMI), according to the Chinese Diabetes Society (CDS) guideline (overweight: BMI ≥ 25 kg/m2; and obesity: BMI ≥ 28 kg/ m2) [17]. Furthermore, the criterion for abdominal obesity was included according to the guideline (waist circumference (WC), men: ≥ 90 cm; and women: ≥ 85 cm) [17].
Taste Testing
Trained investigators administered the following two taste tests according to a standardized operations guide: 1) a salt perception test [18-20], wherein participants were asked to identify solutions that contained any salt, with solutions containing variable but low concentrations of salt (0, 10, 30, 50, and 75 mmol/L); and 2) a salt ‘super-threshold’ test [18-20], wherein participants were asked to indicate which solutions were intolerably salty with solutions containing variable but high concentrations of salt (500, 750, 1000, and 1500 mmol/L). Participants were blinded to the salt concentrations, and samples were presented in a random order assigned by participant number. The taste testing was performed in a designated room at approximately 22-24 °C at each study location. All participants fasted for at least 4 hours before taking the test (no food or beverage except for water). For each taste evaluation, the participants were asked to rinse their mouth thoroughly with deionized water, and then to sip the stimulus solution and hold it in their mouth for approximately 5 seconds to taste it, and then spit it out. Participants were allowed to taste the solution more than once if they were unsure of the selection. If the selection was difficult, the participant was encouraged to make a selection. The tasting of each sample was followed by a rinse with deionized water. All of the solutions were poured into plastic cups (180 ml) containing 10 ml of sample solution and were given at room temperature.
Salty preference evaluation
Based on a pre-test investigation of common salty foods consumed, the top ten edible foods were chosen for salty preference evaluation, including fried pork slices with salted pepper, sautéed sliced pork, poached spicy slices of pork or fish, hot pot, salted pickles, bean paste, pickled potherb mustard, pickled Chinese cabbage, ham, and salted eggs. Participants were asked to report their frequencies of eating these foods for daily, weekly, and monthly periods. For each food, the calculated frequency was expressed as follows: 1) daily: 30, 60, and 90 times; 2) weekly: 4, 8, 12, 16, 20, and 24 times; and 3) monthly: 0, 1, 2, and 3 times. Thus, the salty preference grouping was based on the frequency of salty food consumption, i.e., a low salty preference with a frequency of no more than 8 times; a medium salty preference with a frequency of no more than 20 times; and a high salty preference with a frequency of no less than 24 times. For the participants who preferred eating more than one type of salty food, the summarized frequency was further divided by the number of foods to obtain the average frequency of salty food intake.
Randomization algorithm
Random allocation table was made by the statisticians collaborated with the investigators. For each participant site, Microsoft Excel program was used to generate 20 blocks with 10 patients in each block to increase the equilibrium of probability for either salty perception or salty super-threshold test at first. Sequence of tasting test solutions was randomized according to random number table generated in the same way, although with different blocks and participants number, which were determined by total number of solutions in each test. Once a participant being confirmed to be eligible to this study, the assessor will allocate a randomized number by sequence to the participant and perform the two salt taste tests in a random-order according to the sequence determined by the corresponding randomized number. Allocation by sequence of enrolling randomization is obliged and any of picking randomized number is prohibited. All test solutions were prepared according to the random number table by an independent person, who was not involved in the salty taste test. Both participants and study personnel who were in charge of salt taste test were unaware of the concentration of test solution.
Daily salt intake assessment
Daily salt intake was estimated through measurement of the participants’ 24-hour urinary sodium excretion, as previously described methods [21]. Participants were provided with both verbal and written instructions on how to perform urine collection correctly and accurately. We provided uniform equipments to each participant for collection of urine samples, including a urine collection bottle (50 ml) filled with 5 ml of formaldehyde solution (Sigma, USA), a polypropylene graduated cylinder with a capacity of 1000 ml, a plastic cask (4000 ml), and a black plastic bag in which to carry the bottle. Participants were asked to discard the first specimen obtained on the first morning of the urine collections and then to collect all specimens for up to 24 hours, including the first specimen on the following day. Urine volume was recorded by the investigators. Furthermore, to correct for body size and possible collection errors, urinary sodium excretion was normalized to urinary creatinine excretion by calculating the sodium-to-creatinine ratio (mEq/g) [22, 23].
Diet Questionnaire and Anthropometric Measurements
Between the salty perception test and the salty super-threshold test, a one-hour break was mandatory. During this period, the participants were administered a diet questionnaire and underwent anthropometric measurements. The diet questionnaire included a 19-item general information questionnaire and an 8-item food preference questionnaire. The food preference questionnaire included items that elicited participants’ self-reported preferences for salty and spicy foods in their daily lives. Anthropometric measurements were performed by trained investigators, including blood pressure, waist circumferences, height, and body weight. Blood pressure measurements [24] were performed on both arms of each participant after a 10 minutes’ rest period using a mercury sphygmomanometer while they were in the sitting position. The participants were seated comfortably with the back supported and a bare upper arm without constrictive clothing. Cuffs of the appropriate size were placed at the subject’s arm circumference. The mercury column was slowly deflated at 2 to 3 mm/second, and the first and last audible Korotkoff sounds were taken as the systolic and diastolic blood pressure, respectively. Three readings were taken at intervals of two minutes, and the average value was used as the participant’s blood pressure.
PET/CT scanning
Interventions
Epidemiologic studies have indicated that salt intake of greater than 12 g/day (1 g = 17 mmol NaCl, and 12 g = 204 mmol NaCl) significantly increases the risk of all cardiovascular events [22, 25]. In the current study, the NaCl stimulus solution was applied at a concentration of 200 mmol/L dissolved in deionized water. In total of 36 participants were included while four of them were detected brain lesions and removed from final analysis.
Data acquisition
The participants had fasted overnight prior to intravenous injection of a weight-based amount of 18F-FDG (0.05 mCi/kg). A catheter was placed in an antecubital vein for blood sampling prior to scanning to exclude thrombocytopenia and granulocytopenia. Participants then rested in the recumbent position in an isolated, air-conditioned and dimly lighted room with their eyes blinded for at least 20 minutes. Intravenous injection of 18F-FDG was followed by buccal administration of 10 ml of the test solution for 5 mins. Then, the participants were recumbent in the same condition as described above. Approximately 40-min later, combined brain 18F-FDG PET/CT scanning was performed, with a lead collar covering the thyroid. Imaging started with a low-dose CT scan (35 mAs), which was immediately followed by a PET scan for 10 minutes. CT images were used for attenuation correction and fusion; no contrast medium was used. Helical CT images were acquired first, using the following parameters: 120 kV, and 5-mm-thick sections. The resulting total radiation dose from the low-dose CT-scan and the injected radioactive tracer was approximately 3 mSv. Data from a total of fifty-two participants were included in primary analysis.
Processing analysis
The PET/CT images were processed using Statistical Parametric Mapping (SPM 8.0, the Welcome Department of Cognitive Neurology, University College London, UK). Automated algorithms were implemented to realign each participant’s sequential PET images. A standard whole-brain template provided by the Montreal Neurological Institute (MNI) was used for spatially normalizing individual images to the stereotactic space. After realignment and normalization, the images were smoothed spatially with a Gaussian filter of 10 mm in full-width half-maximum. Global normalization and proportional scaling with 0.8 threshold masking were used. To test our hypothesis, a two sample t-test was used to evaluate the differences between the two scans. The resulting T-score maps were then superimposed onto the SPM-MRI template using the standard MNI coordinates to allow visual inspection of the composite images. To determine whether regional glucose metabolism changes were relevant to the salt intake, we performed a multiple regression analysis using PET images with salt intake as a regressor, and with sex, age, and BMI as covariates. A P ≤ 0.001 (uncorrected, and the display threshold P ≤ 0.005) with a cluster filter of 5 voxels (1 voxel = 8 mm3) was used to identify significant differences between two scans.
Statistical analyses
In human study, the baseline characteristics of the participants were compared between the groups using the chi-squared test for categorical variables and the two sample t-test for continuous variables. The two sample t-test was used to evaluate differences in the PET images between the groups. Linear regression analysis was performed to assess the relationships among salt intake, salty preference, and changes in regional glucose metabolism. Multivariable adjustment for variables, including age, sex, educational level, work status, and fasting blood glucose, as well as the corresponding 95% confidence intervals (95% CIs), were estimated by covariance analysis with a univariate general linear model. To determine whether regional glucose metabolism changes were relevant to the salt intake, we performed a multiple regression analysis using PET images with salt intake as a regressor, and with sex, age, and BMI as covariates. Numerical results were given as the mean ± SD or as the mean and 95% CI. The PET/CT images were processed using the Statistical Parametric Mapping (SPM 8.0), and a critical P ≤ 0.001 (uncorrected, and the display threshold P ≤ 0.005) with a cluster filter of 5 voxels (1 voxel = 8 mm3) was used to identify significant differences. SPM{t} maps were superimposed on a standard magnetic resonance imaging brain template. Numerical statistical analyses were conducted using SPSS software, version 13.0 (SPSS, Inc.) or GraphPad Prism software, version 5.0 (GraphPad Software.), and a two-sided P value of less than 0.05 was considered to indicate statistical significance.
Results
Characteristics of study participants
Baseline characteristics of the participants were presented in Table 1. Significant differences in age, gender, physical activity, and education level were observed between the overweight/ obese and normal weight individuals. In particularly, overweight/obese individuals had higher incidence of hypertension and elevated blood pressure compared with normal weight individuals (Table 1).
Characteristics of the participants * Plus-minus values are means ± SD. † Work status includes light and heavy physical labor. Works like officer, teacher, casher, cooker, driver, doctor, and student et al. are considered light physical labor. While works such as farmer, factory worker, wood worker and construction worker are considered heavy physical labor. ‡ Daily salt intake was derived from 24-hour urinary sodium excretion

Overweight/obese individuals reduced salty taste sensitivity and enhanced salt intake
Daily salt intake was higher in overweight/obese individuals compared with normal weight individuals (13.7 ± 4.5 g/day vs. 11.4 ± 4.2 g/day, P< 0.001, Fig. 1A). Furthermore, a significant positive correlation was detected between daily salt intake and BMI (r = 0.23, P< 0.001, Fig. 1A). Similar findings were observed in individuals with abdominal obesity (Fig. 2). Importantly, after adjustments for confounders such as age, gender, educational level, work status, and FPG, overweight/obese individuals still had a higher salt intake (approximately 2.0 g/day, 95% CI, 1.2-2.8 g/day) compared with normal weight individuals (Table 2). We further showed that overweight/obese individuals had a lower perception of saltiness (P= 0.011) but an increased threshold for declaring a solution to be intolerably salty (P= 0.028) (Fig. 1B, Table 1). Furthermore, no gender differences were found in BMI and salt intake (Fig. 3A). However, a higher threshold for declaring a solution to be intolerably salty was found in normal weight males (Fig. 3C, P = 0.027). Although no differences between male and female were detected in either salty perception (Fig. 3B, P = 0.436) or the threshold (Fig. 3C, P = 0.454), female individuals with overweight/obesity had a higher salt intake than males (Fig. 3D, 14.7 g/day vs. 12.9 g/day, P = 0.006).
Multivariable adjustment of obesity role on salt intake * CI denotes confidence interval. † Model 1 includes adjustment for age, gender, educational level, work status, FPG. ** P<0.01, *** P<0.001 vs. normal weight group


Comparison of salt intake and salty taste between normal weight and overweight/obesity groups. (A) Salt intake in the normal weight (n=363) and overweight/obesity (n=174) groups, and its correlation with individual BMI. *** P<0.001 vs. normal weight. The solid line corresponds to the regression line, and the dashed line represents the 95% confidence band of the best-fit line. (B) Comparison of salty perception (left) and salty super-threshold (right) in the normal weight (n=363) and overweight/obesity (n=174) groups. (C) Salt intake in the normal weight (n=17) and overweight/obesity (n=15) groups, and its correlation with BMI in participants who underwent PET/CT scanning. *** P<0.001 vs. normal weight. The solid line corresponds to the regression line, and the dashed line represents the 95% confidence band of the best-fit line.
Comparison of salt intake and salty taste between normal weight and overweight/obesity groups. (A) Salt intake in the normal weight (n=363) and overweight/obesity (n=174) groups, and its correlation with individual BMI. *** P<0.001 vs. normal weight. The solid line corresponds to the regression line, and the dashed line represents the 95% confidence band of the best-fit line. (B) Comparison of salty perception (left) and salty super-threshold (right) in the normal weight (n=363) and overweight/obesity (n=174) groups. (C) Salt intake in the normal weight (n=17) and overweight/obesity (n=15) groups, and its correlation with BMI in participants who underwent PET/CT scanning. *** P<0.001 vs. normal weight. The solid line corresponds to the regression line, and the dashed line represents the 95% confidence band of the best-fit line.
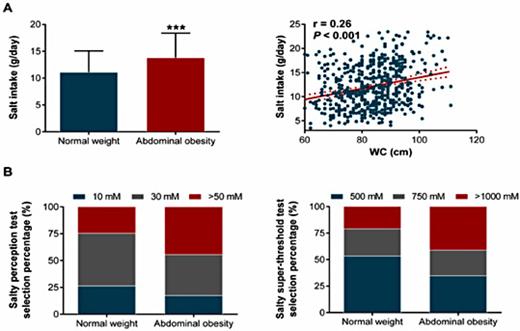
Comparison of salt intake and salty taste between normal weight and abdominal obesity individuals. (A) Salt intake in the normal weight (n=330) and abdominal obesity (n=207) groups, and its correlation with individual WC. *** P<0.001 vs. normal weight. The solid line corresponds to the regression line, and the dashed line represents the 95% confidence band of the best-fit line. (B) Comparison of salty perception (left) and salty super-threshold (right) in the normal weight (n=330) and abdominal obesity (n=207) groups.
Comparison of salt intake and salty taste between normal weight and abdominal obesity individuals. (A) Salt intake in the normal weight (n=330) and abdominal obesity (n=207) groups, and its correlation with individual WC. *** P<0.001 vs. normal weight. The solid line corresponds to the regression line, and the dashed line represents the 95% confidence band of the best-fit line. (B) Comparison of salty perception (left) and salty super-threshold (right) in the normal weight (n=330) and abdominal obesity (n=207) groups.
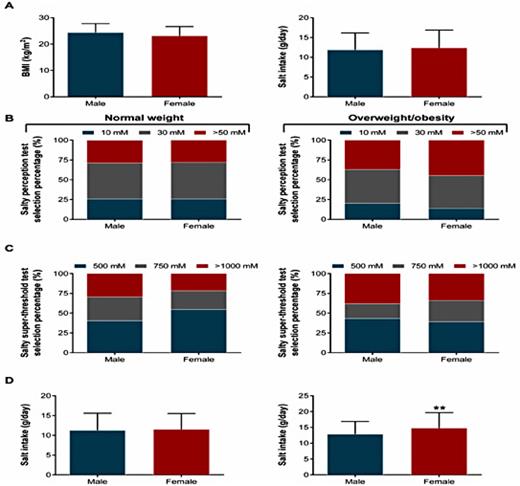
Sex differences of salt intake and salty taste between normal weight and overweight/obesity groups. (A) Comparison of BMI and salt intake between male (n=256) and female (n=281). Comparison of salty perception (B) and salty super-threshold (C) between male and female in the normal weight (male: n=156; female: n=207) and overweight/obesity (male: n=100; female: n=74) groups. (D) Salt intake differences between male and female in the normal weight (male: n=156; female: n=207) and overweight/obesity (male: n=100; female: n=74) groups. ** P<0.01 vs. male.
Sex differences of salt intake and salty taste between normal weight and overweight/obesity groups. (A) Comparison of BMI and salt intake between male (n=256) and female (n=281). Comparison of salty perception (B) and salty super-threshold (C) between male and female in the normal weight (male: n=156; female: n=207) and overweight/obesity (male: n=100; female: n=74) groups. (D) Salt intake differences between male and female in the normal weight (male: n=156; female: n=207) and overweight/obesity (male: n=100; female: n=74) groups. ** P<0.01 vs. male.
Changes in overweight/obesity-related salty taste were associated with increased activity of brain gustatory regions
Next, we determined whether changes in salty taste were correlated with alterations in the central gustatory system. Baseline characteristics of the participants were presented in Table 3, and no significant differences were noted between two groups except for BMI and WC. After ingestion of a high-salt solution, PET/CT scanning revealed that individuals with overweight/obesity had higher activity in several brain regions, including the insula, OFC, and parahippocampus, compared with normal weight individuals (Fig. 4A). Individuals with overweight/obesity enhanced globally normalized glucose metabolisms in these regions (Fig. 4B). Furthermore, significant positive correlations were detected between daily salt intake and normalized glucose metabolisms in the insula (r = 0.38, P= 0.03), OFC (r = 0.44, P= 0.01), and parahippocampalgyrus (r = 0.37, P= 0.04) (Fig. 4C). A correlation between salty preference score and normalized glucose metabolisms was also observed in these regions (Fig. 4D). Similar results were observed in individuals with abdominal obesity (Fig. 5).

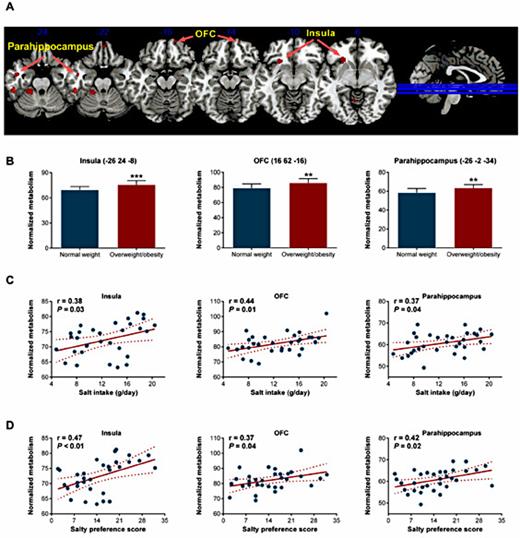
Brain regional metabolism changes in response to high salt intake in overweight/obesity. (A) The brain regions exhibiting higher activity in response to high salt. The images depict two sample t-test for the overweight/obesity group (n=15) vs. the normal weight group (n=17). The significance threshold was set at a P<0.005, and SPM{t} maps were superimposed on a standard magnetic resonance imaging brain template. (B) Comparison of normalized glucose metabolism in the insula, OFC, and parahippocampus between the normal weight (n=17) and overweight/obesity groups (n=15). The peak coordinates of each VOI are shown in parentheses. ** P<0.01, *** P<0.001 vs. normal weight. Linear regression analysis of the relationship of normalized glucose metabolism in the insula (left) /OFC (middle) / parahippocampus (right) with individual salt intake (C) and salty preference scores (D). The solid line corresponds to the regression line, and the dashed line represents the 95% confidence band of the best-fit line.
Brain regional metabolism changes in response to high salt intake in overweight/obesity. (A) The brain regions exhibiting higher activity in response to high salt. The images depict two sample t-test for the overweight/obesity group (n=15) vs. the normal weight group (n=17). The significance threshold was set at a P<0.005, and SPM{t} maps were superimposed on a standard magnetic resonance imaging brain template. (B) Comparison of normalized glucose metabolism in the insula, OFC, and parahippocampus between the normal weight (n=17) and overweight/obesity groups (n=15). The peak coordinates of each VOI are shown in parentheses. ** P<0.01, *** P<0.001 vs. normal weight. Linear regression analysis of the relationship of normalized glucose metabolism in the insula (left) /OFC (middle) / parahippocampus (right) with individual salt intake (C) and salty preference scores (D). The solid line corresponds to the regression line, and the dashed line represents the 95% confidence band of the best-fit line.

Brain regional metabolism and neural activity changes in response to high salt intake in abdominal obesity. (A) The brain regions exhibiting higher activity in response to high salt. The images depict two sample t-test for the abdominal obesity group (n=16) vs. the normal weight group (n=16). The significance threshold was set at a P<0.005, and SPM{t} maps were superimposed on a standard magnetic resonance imaging brain template. (B) Comparison of normalized glucose metabolism in the insula, OFC, and parahippocampus between the normal weight (n=16) and abdominal obesity groups (n=16). The peak coordinates of each VOI are shown in parentheses. * P<0.05, ** P<0.01 vs. normal weight. Linear regression analysis of the relationship of normalized glucose metabolism in the insula (left) /OFC (middle) / parahippocampus (right) with individual salt intake (C) and salty preference scores (D). The solid line corresponds to the regression line, and the dashed line represents the 95% confidence band of the best-fit line.
Brain regional metabolism and neural activity changes in response to high salt intake in abdominal obesity. (A) The brain regions exhibiting higher activity in response to high salt. The images depict two sample t-test for the abdominal obesity group (n=16) vs. the normal weight group (n=16). The significance threshold was set at a P<0.005, and SPM{t} maps were superimposed on a standard magnetic resonance imaging brain template. (B) Comparison of normalized glucose metabolism in the insula, OFC, and parahippocampus between the normal weight (n=16) and abdominal obesity groups (n=16). The peak coordinates of each VOI are shown in parentheses. * P<0.05, ** P<0.01 vs. normal weight. Linear regression analysis of the relationship of normalized glucose metabolism in the insula (left) /OFC (middle) / parahippocampus (right) with individual salt intake (C) and salty preference scores (D). The solid line corresponds to the regression line, and the dashed line represents the 95% confidence band of the best-fit line.
Discussion
The major new findings of the present study are that overweight/obese individuals are prone to consume more salt, in association with reduced salt sensitivity and a higher salty preference. Our brain molecular imaging study has also provided novel mechanistic insights into the alterations in salty taste and salty preference that occurred in overweight/obese individuals by demonstrating their associations with increased activity in several brain regions, including the insula, OFC, and parahippocampus.
Obesity and hypertension are often comorbid in clinic, furthermore, obesity is a well-established etiological factor for hypertension, and associated with increased risk of CV events in hypertensive patients [26]. In addition to the higher incidence of hypertension and elevated blood pressure in overweight/obese individuals, these individuals increased their daily salt intake. High salt intake is a well-known risk factor for development of hypertension. Although the correlation between high salt intake and obesity is observed, the mechanisms underlying this circumstance remain elusive. The high salt intake in obese individuals might be related to salt-induced thirst [27], or it may be a consequence of overeating [28]. However, a previous study showed that thirsty participants liked optimal stimuli more, but liked suboptimal stimuli less, relative to controls. Under such scenario, obese participants might experience unhappy feelings on high salt intake. Meanwhile, a recent study showed that food intake was not associated with sodium intake in obese subjects [29]. Thus, overeating behavior might not account for high salt intake in obese participants.
Abnormal taste preferences for sweet and fatty foods contribute to weight gain [6, 30]. Although numerous factors possibly influence taste preference, taste sensitivity plays a crucial role. Reduced taste sensitivities to sweet and fat have been observed in obese individuals [30, 31]. Changes in salty taste have also been reported in both human and rodents with obesity but the results were inconsistent [6-8, 32]. Obese individuals, especially females, have a lower salt sensitivity and altered salt preference, as well as change their eating behaviors [32-34]. In this study, we also showed that obese individuals had reduced salt sensitivity, as indicated by their lower salt perception and higher salt super-threshold, accompanied by their higher salty preference according to our food-preference questionnaire. Furthermore, no gender difference in salt sensitivity was observed among the obese individuals, although the overweight/obese females had a higher salt intake. Therefore, altered salty hedonic and especially increased salty preference might directly contribute to the increased salt intake in obesity.
Palatability is the sensory stimulation of appetite and can influence food choice and intake. Obese subjects perceive sweet and fatty foods to be more pleasant than their lean counterparts [35]. Furthermore, palatability is the consequence of stimulation of brain reward pathways, and the neural circuitry of obese subjects might be super-sensitive to the hedonic properties of foods [36, 37]. Previous studies on sweet taste showed that obese individuals experience neural activity changes in the hypothalamus, amygdala, OFC, insula, and hippocampus/parahippocampus [9, 10]. In humans, the insula is the primary gustatory cortex responding to intensity of taste, and the OFC serves as the secondary taste cortex and is involved in reward circuits [38]. In this study, our PET/CT image study showed that overweight/obesity individuals increased activity in the insula, OFC, and parahippocampus following tasting a high-salt solution. Furthermore, the normalized glucose metabolism in these regions was positively correlated with the individual salt intake and salty preference score. Interestingly, the OFC and parahippocampus can retain the food memories that interact with the reward–based decision-making process, which may be involved in food-seeking behaviors [39]. Our results potentially provide physiologic insights indicating that overweight/obesity individuals develop a less adverse reaction to high salt intake and a more hedonic response to salty taste than normal weight individuals.
The neurobiological regulation of eating is complex, and several neurochemical pathways has been suggested involving in brain reward circuitry: serotonergic, enkephalinergic, GABAergic, and dopaminergic (DA) [40]. Among those neurotransmitters, DA D2 receptors has been credited with the reinforcing responses to food intake [41], which may lead to loss of eating control. Wang et al. found that the availability of DA D2 receptor was decreased in obese individuals, and these reductions were proportional to their BMI [37]. Furthermore, imaging studies has revealed that D2 receptor availability was associated with prefrontal metabolism (including OFC) [42]. Thus, those sfttudies suggested that decreases in D2 receptors in obese subjects contribute to overeating in part through dysregulation of prefrontal regions implicated in inhibitory control and emotional regulation [43]. Thereby, mechanisms by which dopamine regulates the reinforcing properties of food worthy further study.
Our study has several limitations. First, increase body mass index is commonly associated with more food intake because of higher metabolic demands, which could be related to the observed higher salt intake in overweight/obese individuals. Thus, accuracy measurement of individual daily food intake is helpful to evaluate this relevance, but this method is difficult to be used in population survey. Furthermore, a study failed to show a correlation between food intake and sodium intake in obese subjects [44]. Second, BMI is a potentially confounder in correlation analysis between salt intake and PET images, the result could be more convinced if using a conjunction of statistically independent associations. Finally, our clinical study was limited by its cross-sectional nature, it is unknown whether the findings can be generalized to other populations outside of China.
Conclusion
In summary, overweight/obese individuals are prone to having a high daily salt intake, which was associated with altered salt sensitivity and preference and the abnormal central activity. This study provided insights for reducing daily salt intake in overweight/obese individuals by modifying the neural processing of salty taste and the reward circuits for salty preference in the brain.
Acknowledgements
We thank Lijuan Wang and Tingbing Cao for their technical assistance, and professor Kaifa Wang for his kindly help with statistical analysis. We thank professor Martin Tepel for his suggestions in study design and implementation. This study was supported by grants from the National Basic Research Program of China (2013CB531205), and the National Natural Science Foundation of China (81721001, 81630015, 31430042, 91339000, and IRT1216). The funders had no role in the design and conduct of the study; collection, management, analysis, and interpretation of the data; and preparation, review, or approval of the manuscript.
Disclosure Statement
All authors have nothing to disclose.
References
Q. Li and R. Jin contributed equally to this work.

